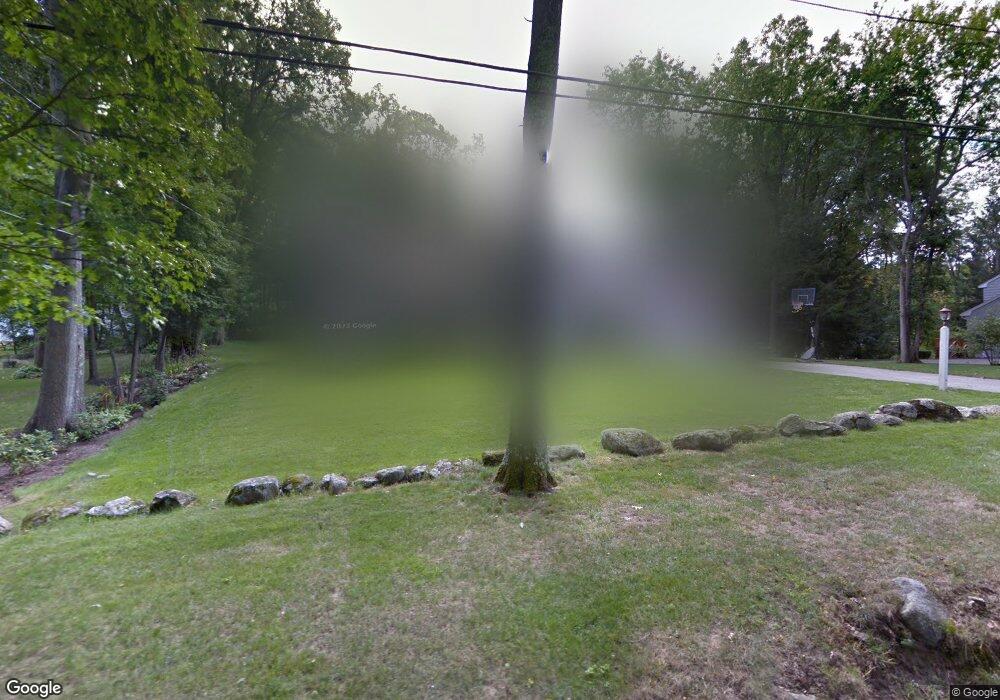
30 Bannister Rd Andover, MA 01810
Ballardvale NeighborhoodEstimated Value: $913,000 - $993,000
3
Beds
2
Baths
2,184
Sq Ft
$428/Sq Ft
Est. Value
About This Home
This home is located at 30 Bannister Rd, Andover, MA 01810 and is currently estimated at $934,908, approximately $428 per square foot. 30 Bannister Rd is a home located in Essex County with nearby schools including South Elementary School, Andover West Middle School, and Andover High School.
Ownership History
Date
Name
Owned For
Owner Type
Purchase Details
Closed on
Dec 1, 2006
Sold by
Gerraughty James V
Bought by
Nusky Kevin D and Nusky Kirstin L
Current Estimated Value
Home Financials for this Owner
Home Financials are based on the most recent Mortgage that was taken out on this home.
Original Mortgage
$300,000
Interest Rate
6.36%
Mortgage Type
Purchase Money Mortgage
Create a Home Valuation Report for This Property
The Home Valuation Report is an in-depth analysis detailing your home's value as well as a comparison with similar homes in the area
Home Values in the Area
Average Home Value in this Area
Purchase History
| Date | Buyer | Sale Price | Title Company |
|---|---|---|---|
| Nusky Kevin D | $430,000 | -- | |
| Nusky Kevin D | $430,000 | -- |
Source: Public Records
Mortgage History
| Date | Status | Borrower | Loan Amount |
|---|---|---|---|
| Open | Nusky Kevin D | $305,000 | |
| Closed | Nusky Kevin D | $297,000 | |
| Closed | Nusky Kevin D | $300,000 |
Source: Public Records
Tax History Compared to Growth
Tax History
| Year | Tax Paid | Tax Assessment Tax Assessment Total Assessment is a certain percentage of the fair market value that is determined by local assessors to be the total taxable value of land and additions on the property. | Land | Improvement |
|---|---|---|---|---|
| 2024 | $9,669 | $750,700 | $410,300 | $340,400 |
| 2023 | $9,260 | $677,900 | $369,500 | $308,400 |
| 2022 | $8,802 | $602,900 | $321,400 | $281,500 |
| 2021 | $8,420 | $550,700 | $292,200 | $258,500 |
| 2020 | $8,075 | $538,000 | $285,100 | $252,900 |
| 2019 | $7,988 | $523,100 | $276,700 | $246,400 |
| 2018 | $7,707 | $492,800 | $266,200 | $226,600 |
| 2017 | $7,355 | $484,500 | $260,900 | $223,600 |
| 2016 | $7,203 | $486,000 | $260,900 | $225,100 |
| 2015 | $6,952 | $464,400 | $250,700 | $213,700 |
Source: Public Records
Map
Nearby Homes