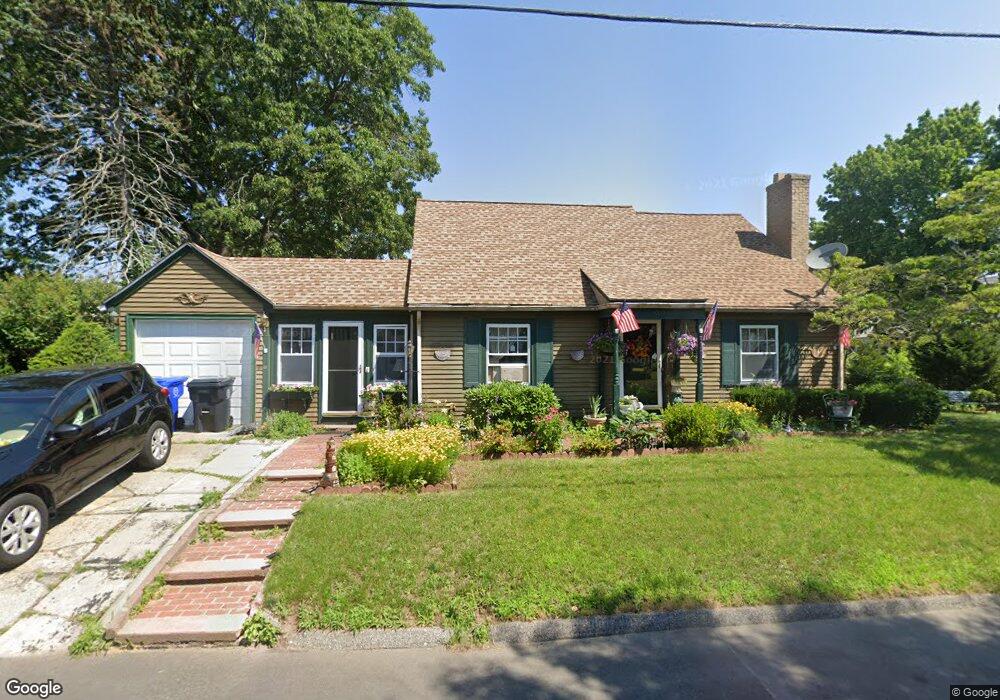
30 Benedict St Riverside, RI 02915
Riverside NeighborhoodEstimated Value: $438,000 - $467,000
3
Beds
1
Bath
1,525
Sq Ft
$294/Sq Ft
Est. Value
About This Home
This home is located at 30 Benedict St, Riverside, RI 02915 and is currently estimated at $448,541, approximately $294 per square foot. 30 Benedict St is a home located in Providence County with nearby schools including East Providence High School, St Luke Elementary School, and St Mary Academy-Bay View.
Ownership History
Date
Name
Owned For
Owner Type
Purchase Details
Closed on
Dec 4, 2024
Sold by
Reposa Sheila A
Bought by
Mesh Sherri L and Reposa Ronald J
Current Estimated Value
Create a Home Valuation Report for This Property
The Home Valuation Report is an in-depth analysis detailing your home's value as well as a comparison with similar homes in the area
Home Values in the Area
Average Home Value in this Area
Purchase History
| Date | Buyer | Sale Price | Title Company |
|---|---|---|---|
| Mesh Sherri L | -- | None Available | |
| Mesh Sherri L | -- | None Available | |
| Mesh Sherri L | -- | None Available |
Source: Public Records
Tax History
| Year | Tax Paid | Tax Assessment Tax Assessment Total Assessment is a certain percentage of the fair market value that is determined by local assessors to be the total taxable value of land and additions on the property. | Land | Improvement |
|---|---|---|---|---|
| 2025 | $5,502 | $421,000 | $139,200 | $281,800 |
| 2024 | $5,434 | $354,500 | $115,900 | $238,600 |
| 2023 | $5,232 | $354,500 | $115,900 | $238,600 |
| 2022 | $5,198 | $237,800 | $64,800 | $173,000 |
| 2021 | $5,113 | $237,800 | $59,400 | $178,400 |
| 2020 | $4,896 | $237,800 | $59,400 | $178,400 |
| 2019 | $4,761 | $237,800 | $59,400 | $178,400 |
| 2018 | $4,780 | $208,900 | $57,800 | $151,100 |
| 2017 | $4,673 | $208,900 | $57,800 | $151,100 |
| 2016 | $4,650 | $208,900 | $57,800 | $151,100 |
| 2015 | $4,562 | $198,800 | $53,600 | $145,200 |
| 2014 | $4,562 | $198,800 | $53,600 | $145,200 |
Source: Public Records
Map
Nearby Homes
- 14 Benedict St
- 14 Winthrop St
- 25 Winslow St
- 85 Hilton Ave
- 15 Plaza Dr
- 15 Claire St
- 23 Albert Ave
- 10 Booth Ave
- 103 Burnside Ave
- 6 Hazelton Rd
- 72 Stowe Ave
- 41 White Ave
- 33 Pine St Unit 35
- 45 Washington Rd
- 151 Willett Ave Unit 2
- 0 Carousel Dr
- 28 Jefferson Ave
- 65 Estrell Dr
- 129 Shore Rd
- 43 Bullocks Point Ave Unit 4A
Your Personal Tour Guide
Ask me questions while you tour the home.