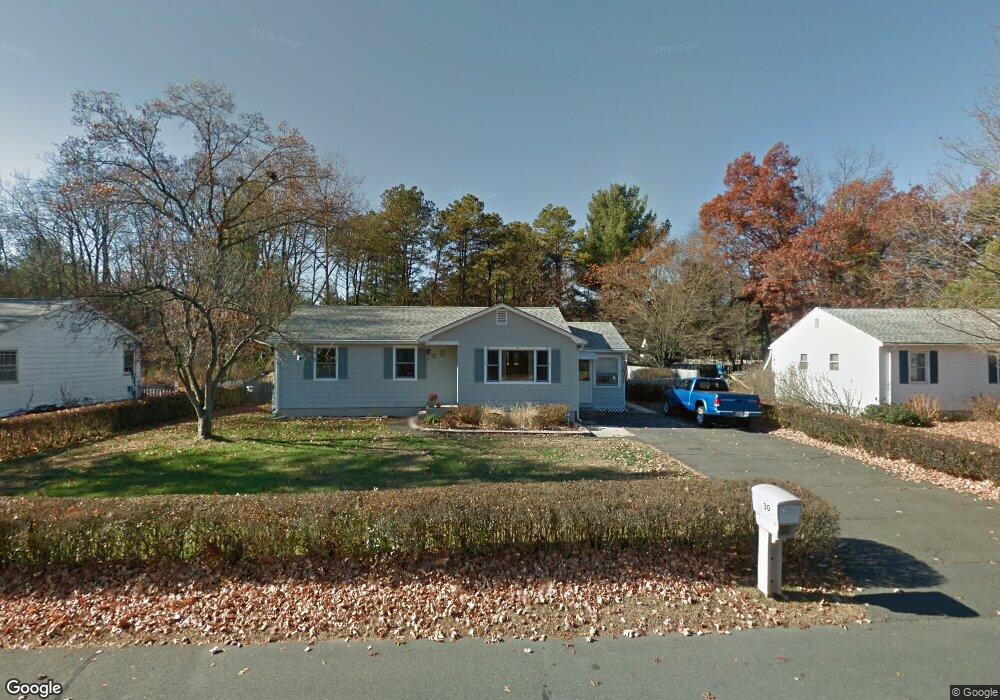
30 Beyer Dr Easthampton, MA 01027
Estimated Value: $330,000 - $343,606
3
Beds
2
Baths
1,011
Sq Ft
$335/Sq Ft
Est. Value
About This Home
This home is located at 30 Beyer Dr, Easthampton, MA 01027 and is currently estimated at $338,402, approximately $334 per square foot. 30 Beyer Dr is a home located in Hampshire County with nearby schools including Easthampton High School, Calvary Baptist Christian School, and Westfield Christian Academy.
Ownership History
Date
Name
Owned For
Owner Type
Purchase Details
Closed on
Oct 16, 2025
Sold by
Neal Kristine J and Haswell Allison M
Bought by
Tatro Paul R
Current Estimated Value
Purchase Details
Closed on
Apr 23, 2022
Sold by
Tatro Paul R
Bought by
Anischik Kristine J and Haswell Allison M
Purchase Details
Closed on
Jan 17, 2018
Sold by
Tatro Paul R and Tatro Lorraine B
Bought by
Tatro Paul R
Purchase Details
Closed on
Apr 7, 2015
Sold by
Haswell Allison M and Anischik Kristine J
Bought by
Tatro Paul R and Tatro Lorraine B
Purchase Details
Closed on
Jan 23, 2012
Sold by
Tatro Paul R and Tatro Lorraine B
Bought by
Haswell Allison M and Anischik Kristine J
Create a Home Valuation Report for This Property
The Home Valuation Report is an in-depth analysis detailing your home's value as well as a comparison with similar homes in the area
Home Values in the Area
Average Home Value in this Area
Purchase History
| Date | Buyer | Sale Price | Title Company |
|---|---|---|---|
| Tatro Paul R | -- | -- | |
| Anischik Kristine J | -- | None Available | |
| Tatro Paul R | -- | -- | |
| Tatro Paul R | -- | -- | |
| Haswell Allison M | -- | -- |
Source: Public Records
Mortgage History
| Date | Status | Borrower | Loan Amount |
|---|---|---|---|
| Previous Owner | Haswell Allison M | $40,000 | |
| Previous Owner | Haswell Allison M | $57,754 |
Source: Public Records
Tax History
| Year | Tax Paid | Tax Assessment Tax Assessment Total Assessment is a certain percentage of the fair market value that is determined by local assessors to be the total taxable value of land and additions on the property. | Land | Improvement |
|---|---|---|---|---|
| 2025 | $4,426 | $323,800 | $118,300 | $205,500 |
| 2024 | $4,273 | $315,100 | $114,900 | $200,200 |
| 2023 | $3,239 | $221,100 | $90,400 | $130,700 |
| 2022 | $3,655 | $221,100 | $90,400 | $130,700 |
| 2021 | $4,188 | $227,800 | $90,400 | $137,400 |
| 2020 | $3,927 | $221,100 | $90,400 | $130,700 |
| 2019 | $3,295 | $213,100 | $90,400 | $122,700 |
| 2018 | $3,158 | $197,400 | $85,400 | $112,000 |
| 2017 | $3,082 | $190,100 | $82,100 | $108,000 |
| 2016 | $3,062 | $196,400 | $82,100 | $114,300 |
| 2015 | -- | $196,400 | $82,100 | $114,300 |
Source: Public Records
Map
Nearby Homes
Your Personal Tour Guide
Ask me questions while you tour the home.