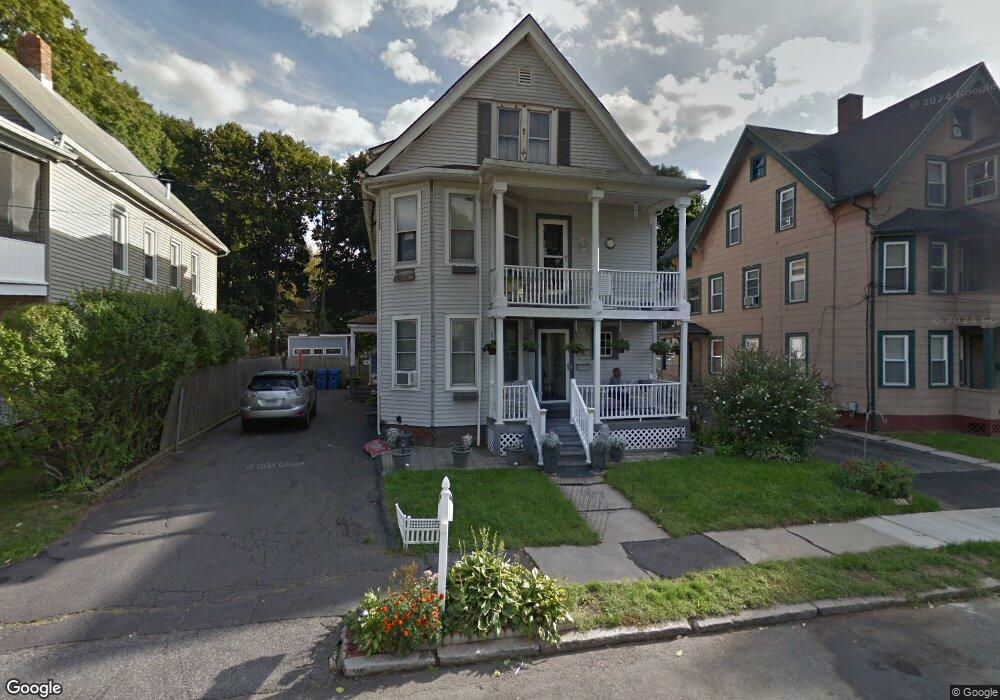
30 Breckenridge Ave Meriden, CT 06450
Estimated Value: $275,000 - $385,000
7
Beds
3
Baths
3,201
Sq Ft
$106/Sq Ft
Est. Value
About This Home
This home is located at 30 Breckenridge Ave, Meriden, CT 06450 and is currently estimated at $340,770, approximately $106 per square foot. 30 Breckenridge Ave is a home located in New Haven County with nearby schools including John Barry School, Francis T. Maloney High School, and Chase Collegiate School.
Ownership History
Date
Name
Owned For
Owner Type
Purchase Details
Closed on
Aug 13, 2014
Sold by
Moorer Roy L
Bought by
Moorer Louise M
Current Estimated Value
Purchase Details
Closed on
Feb 17, 2010
Sold by
Moorer Louise
Bought by
Moorer Roy and Moorer Louise
Home Financials for this Owner
Home Financials are based on the most recent Mortgage that was taken out on this home.
Original Mortgage
$285,000
Interest Rate
5.17%
Mortgage Type
Commercial
Purchase Details
Closed on
Sep 22, 1995
Sold by
Sowamco 14 Ltd
Bought by
Moorer Louise
Home Financials for this Owner
Home Financials are based on the most recent Mortgage that was taken out on this home.
Original Mortgage
$57,000
Interest Rate
7.81%
Mortgage Type
Unknown
Create a Home Valuation Report for This Property
The Home Valuation Report is an in-depth analysis detailing your home's value as well as a comparison with similar homes in the area
Home Values in the Area
Average Home Value in this Area
Purchase History
| Date | Buyer | Sale Price | Title Company |
|---|---|---|---|
| Moorer Louise M | -- | -- | |
| Moorer Roy | -- | -- | |
| Moorer Louise | $60,000 | -- |
Source: Public Records
Mortgage History
| Date | Status | Borrower | Loan Amount |
|---|---|---|---|
| Previous Owner | Moorer Louise | $285,000 | |
| Previous Owner | Moorer Louise | $32,880 | |
| Previous Owner | Moorer Louise | $57,000 |
Source: Public Records
Tax History Compared to Growth
Tax History
| Year | Tax Paid | Tax Assessment Tax Assessment Total Assessment is a certain percentage of the fair market value that is determined by local assessors to be the total taxable value of land and additions on the property. | Land | Improvement |
|---|---|---|---|---|
| 2025 | $5,838 | $154,000 | $39,060 | $114,940 |
| 2024 | $5,931 | $154,000 | $39,060 | $114,940 |
| 2023 | $5,716 | $154,000 | $39,060 | $114,940 |
| 2022 | $5,393 | $154,000 | $39,060 | $114,940 |
| 2021 | $4,778 | $109,760 | $37,170 | $72,590 |
| 2020 | $4,765 | $109,760 | $37,170 | $72,590 |
| 2019 | $4,724 | $109,760 | $37,170 | $72,590 |
| 2018 | $4,743 | $109,760 | $37,170 | $72,590 |
| 2017 | $4,617 | $109,760 | $37,170 | $72,590 |
| 2016 | $4,264 | $110,040 | $27,650 | $82,390 |
| 2015 | $4,264 | $109,970 | $27,580 | $82,390 |
| 2014 | $4,160 | $109,970 | $27,580 | $82,390 |
Source: Public Records
Map
Nearby Homes
- 51 Griswold St
- 30 Tremont St
- 52 Webster St
- 33 Prescott St
- 23 Howe St
- 22 Webster St
- 181 Hicks St Unit 2C
- 387 Colony St
- 618 Blackstone Village
- 53 Woodland St
- 465 Pratt Street Extension
- 149 Woodland St
- 19 Blackstone St
- 35 Morse St
- 145 Camp St
- 396 Gracey Ave
- 334 Gracey Ave
- 246 Pratt St
- 129 Orchard St
- 64 Fair St
- 24 Breckenridge Ave
- 34 Breckenridge Ave
- 18 Breckenridge Ave
- 38 Breckenridge Ave
- 14 Breckenridge Ave
- 142 Britannia St
- 146 Britannia St
- 27 Breckenridge Ave
- 126 Britannia St
- 132 Britannia St
- 23 Breckenridge Ave
- 17 Breckenridge Ave
- 26 Griswold St
- 24 Griswold St
- 42 Breckenridge Ave
- 156 Britannia St
- 30 Griswold St
- 152 Britannia St
- 120 Britannia St
- 128 Britannia St