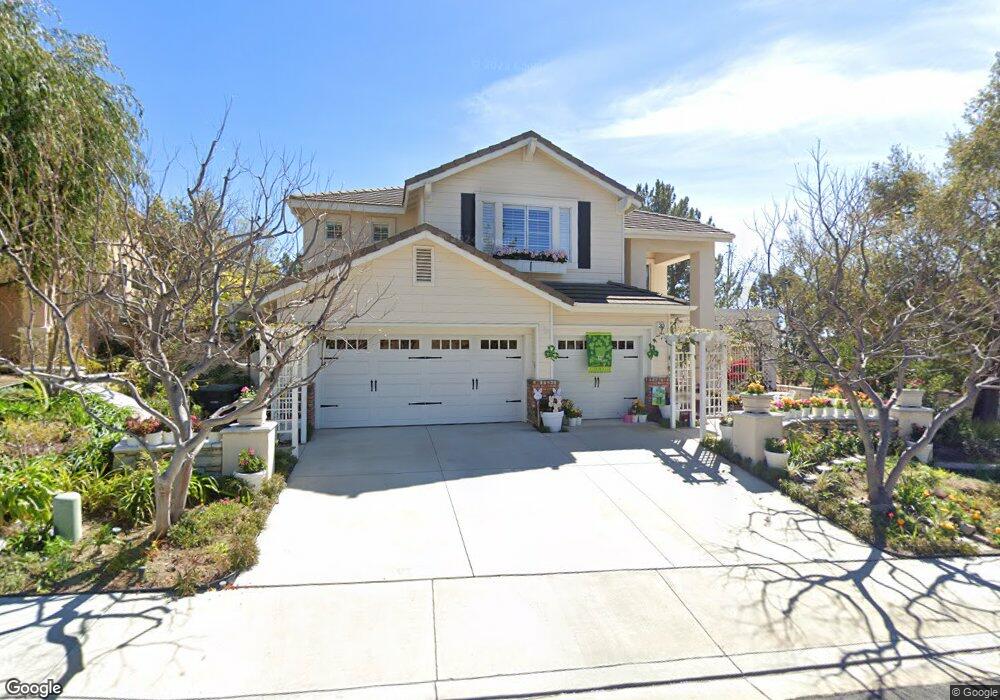
30 Celonova Place Foothill Ranch, CA 92610
Estimated Value: $1,579,210 - $1,847,000
About This Home
This home is located at 30 Celonova Place, Foothill Ranch, CA 92610 and is currently estimated at $1,660,053, approximately $576 per square foot. 30 Celonova Place is a home located in Orange County with nearby schools including Foothill Ranch Elementary School, Rancho Santa Margarita Intermediate School, and Trabuco Hills High School.
Ownership History
Purchase Details
Purchase Details
Home Financials for this Owner
Home Financials are based on the most recent Mortgage that was taken out on this home.Home Values in the Area
Average Home Value in this Area
Purchase History
We collect this data history from publicly available records. To have your information removed, we recommend requesting removal directly through your county’s website.
| Date | Buyer | Sale Price | Title Company |
|---|---|---|---|
| Challet Gilbert L | -- | -- | |
| Challet Gilbert L | -- | -- | |
| Challet Gilbert L | $281,000 | First American Title | |
| Challet Gilbert L | $281,000 | -- |
Mortgage History
We collect this data history from publicly available records. To have your information removed, we recommend requesting removal directly through your county’s website.
| Date | Status | Borrower | Loan Amount |
|---|---|---|---|
| Previous Owner | Challet Gilbert L | $131,900 |
Tax History
| Year | Tax Paid | Tax Assessment Tax Assessment Total Assessment is a certain percentage of the fair market value that is determined by local assessors to be the total taxable value of land and additions on the property. | Land | Improvement |
|---|---|---|---|---|
| 2025 | $4,714 | $470,547 | $79,831 | $390,716 |
| 2024 | $4,714 | $461,321 | $78,266 | $383,055 |
| 2023 | $4,601 | $452,276 | $76,731 | $375,545 |
| 2022 | $4,518 | $443,408 | $75,226 | $368,182 |
| 2021 | $3,444 | $434,714 | $73,751 | $360,963 |
| 2020 | $4,386 | $430,257 | $72,995 | $357,262 |
| 2019 | $4,298 | $421,821 | $71,564 | $350,257 |
| 2018 | $4,216 | $413,550 | $70,160 | $343,390 |
| 2017 | $4,131 | $405,442 | $68,785 | $336,657 |
| 2016 | $5,182 | $397,493 | $67,437 | $330,056 |
| 2015 | $5,200 | $391,523 | $66,424 | $325,099 |
| 2014 | $6,133 | $383,854 | $65,123 | $318,731 |
Map
- 24 Calabria Ln
- 123 Chaumont Cir
- 277 Chaumont Cir
- 19431 Rue de Valore Unit 19B
- 45 Parterre Ave
- 5 Chatri Cir
- 18 Chatri Cir
- 22 Balise Ln
- 51 La Perla
- 4 Santa Rita
- 9 Sierra Blanco
- 50 Blanco
- 10 Verano
- 406 El Paseo
- 28286 Pueblo Dr
- 1132 Summit Oak Dr
- 131 Primrose Dr
- 28411 Klondike Dr Unit 53
- 1412 El Paseo
- 28561 Camelback Rd
- 28 Celonova Place
- 26 Celonova Place
- 3 Parrell Ave
- 24 Celonova Place
- 2 Parrell Ave
- 5 Parrell Ave
- 22 Celonova Place
- 6 Pallazo Cir
- 4 Parrell Ave
- 8 Pallazo Cir
- 7 Parrell Ave
- 6 Parrell Ave
- 4 Pallazo Cir
- 20 Celonova Place
- 9 Parrell Ave
- 8 Parrell Ave
- 68 Avignon Ave
- 66 Avignon Ave
- 70 Avignon Ave
- 5 Pallazo Cir
Ask me questions while you tour the home.