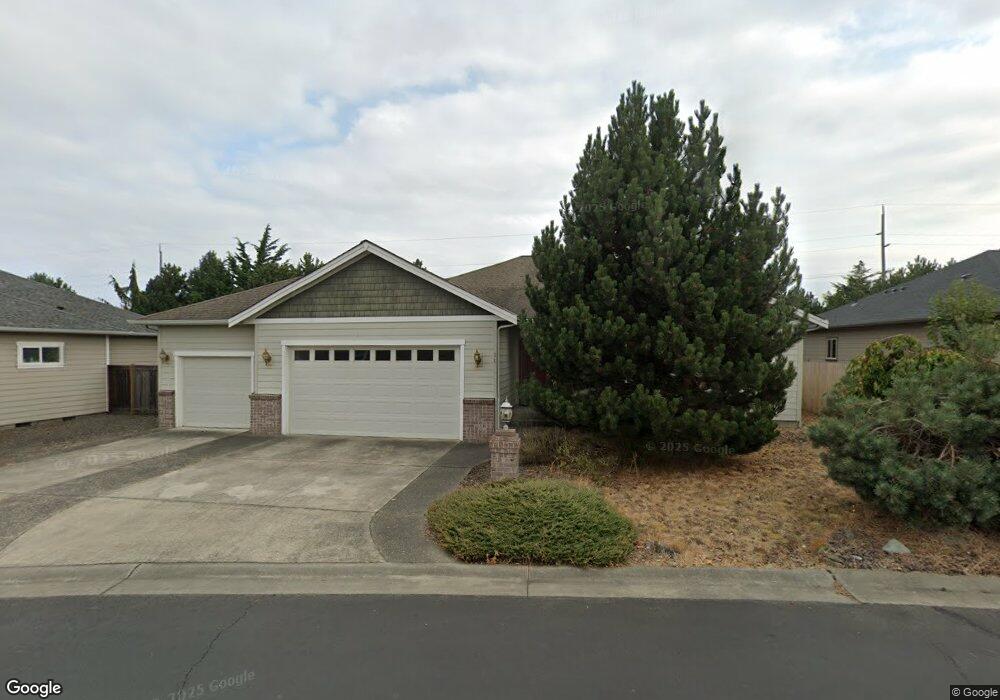
30 Choice Loop Sequim, WA 98382
Estimated Value: $552,871 - $604,000
2
Beds
2
Baths
1,764
Sq Ft
$332/Sq Ft
Est. Value
About This Home
This home is located at 30 Choice Loop, Sequim, WA 98382 and is currently estimated at $585,624, approximately $331 per square foot. 30 Choice Loop is a home located in Clallam County with nearby schools including Helen Haller Elementary School, Sequim Middle School, and Sequim Senior High School.
Ownership History
Date
Name
Owned For
Owner Type
Purchase Details
Closed on
Mar 21, 2009
Sold by
Mansfield P Suzan
Bought by
Tice David N
Current Estimated Value
Purchase Details
Closed on
Jul 11, 2007
Sold by
Chamblin Keith and Chamblin Debbie
Bought by
Mansfield P Suzan
Home Financials for this Owner
Home Financials are based on the most recent Mortgage that was taken out on this home.
Original Mortgage
$304,500
Interest Rate
6.41%
Mortgage Type
Purchase Money Mortgage
Purchase Details
Closed on
Mar 29, 2007
Sold by
Chamblin Keith and Chamblin Debbie
Bought by
Chamblin Keith and Chamblin Debbie
Purchase Details
Closed on
Sep 7, 2006
Sold by
Rohrer Custome Homes Inc
Bought by
Chamblin Keith and Chamblin Debbie
Home Financials for this Owner
Home Financials are based on the most recent Mortgage that was taken out on this home.
Original Mortgage
$240,000
Interest Rate
6.87%
Mortgage Type
Adjustable Rate Mortgage/ARM
Create a Home Valuation Report for This Property
The Home Valuation Report is an in-depth analysis detailing your home's value as well as a comparison with similar homes in the area
Purchase History
| Date | Buyer | Sale Price | Title Company |
|---|---|---|---|
| Tice David N | -- | None Available | |
| Mansfield P Suzan | -- | Land Title And Escrow Co | |
| Chamblin Keith | -- | Land Title & Escrow Co | |
| Chamblin Keith | $300,000 | Land Title Co |
Source: Public Records
Mortgage History
| Date | Status | Borrower | Loan Amount |
|---|---|---|---|
| Previous Owner | Mansfield P Suzan | $304,500 | |
| Previous Owner | Chamblin Keith | $240,000 |
Source: Public Records
Tax History
| Year | Tax Paid | Tax Assessment Tax Assessment Total Assessment is a certain percentage of the fair market value that is determined by local assessors to be the total taxable value of land and additions on the property. | Land | Improvement |
|---|---|---|---|---|
| 2025 | $3,749 | $512,719 | $84,700 | $428,019 |
| 2023 | $3,749 | $496,062 | $80,500 | $415,562 |
| 2022 | $3,780 | $507,768 | $70,000 | $437,768 |
| 2021 | $3,392 | $408,894 | $55,000 | $353,894 |
| 2020 | $3,475 | $331,474 | $39,627 | $291,847 |
| 2018 | $3,102 | $306,253 | $39,627 | $266,626 |
| 2017 | $1,403 | $251,135 | $39,627 | $211,508 |
| 2016 | $2,184 | $253,831 | $39,627 | $214,204 |
| 2015 | $2,184 | $231,168 | $39,627 | $191,541 |
| 2013 | $2,184 | $213,755 | $39,627 | $174,128 |
| 2012 | $2,184 | $216,457 | $40,256 | $176,201 |
Source: Public Records
Map
Nearby Homes
- 881 N Iris Ave
- 71 Heron Way Unit A
- 71 Heron Way Unit B
- 181 Duke Dr
- 896 N Rock Rose Ave
- 866 N Rock Rose Ave Unit N Rock Rose Ave
- 866 N Rock Rose Ave
- 886 N Rock Rose Ave
- 420 Cove Ln
- 920 Starboard Way
- 955 N 5th Ave
- 148 Sunland Dr
- 871 N Oxford Way
- 892 N Oxford Way Unit 617
- 187 Sunland Dr
- 830 N Canterbury Ct
- 842 N Canterbury Ct
- 844 N Canterbury Ct
- 833 N Canterbury Ct
- 560 W Minstrel Rd
- 10 Choice Loop
- 0 Choice Loop Unit 28143650
- 0 Choice Loop Unit 28136003
- 0 Choice Loop Unit 28049011
- 24 Choice Loop
- 0 Choice Loop Unit 1730598
- 20 Choice Loop
- 40 Choice Loop
- 13 Choice Loop
- 794 Sequim Dungeness Way
- 10 Nesting Place
- 50 Choice Loop
- 11 Nesting Place
- 50 Choice Loop
- L57 Choice Loop
- L21 Choice Loop
- 0 Lot 10 Choice Loop
- XXX Choice Loop
- Lot 8 Choice Loop
- Lot 9 Choice Loop
Your Personal Tour Guide
Ask me questions while you tour the home.