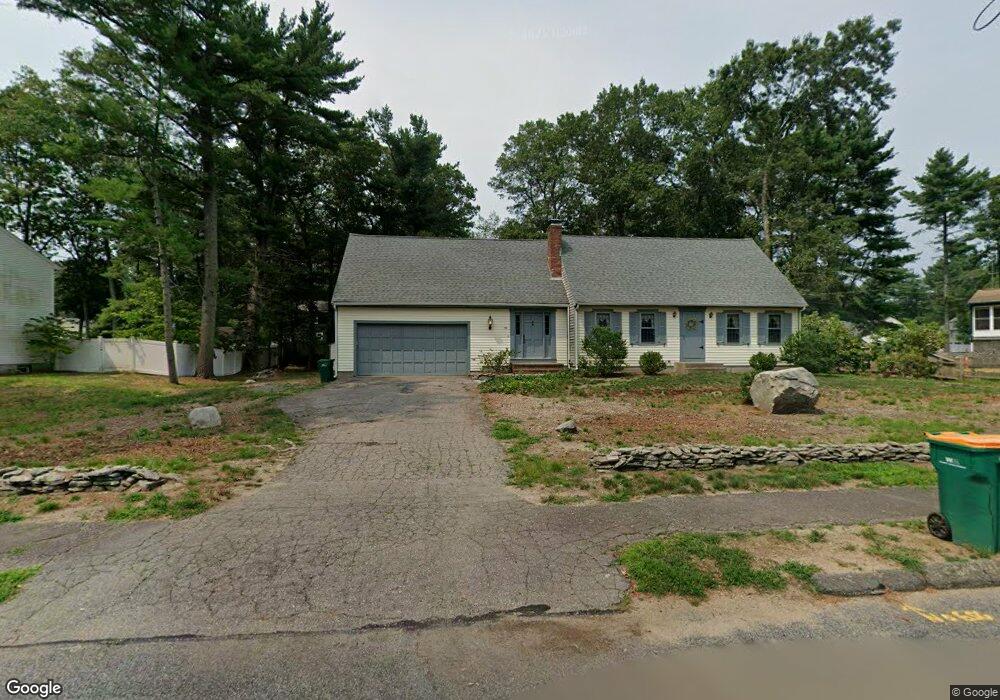
30 Coach Rd Mansfield, MA 02048
Estimated Value: $850,107 - $1,061,000
4
Beds
3
Baths
3,132
Sq Ft
$299/Sq Ft
Est. Value
About This Home
This home is located at 30 Coach Rd, Mansfield, MA 02048 and is currently estimated at $937,527, approximately $299 per square foot. 30 Coach Rd is a home located in Bristol County with nearby schools including Everett W. Robinson Elementary School, Jordan/Jackson Elementary School, and Harold L. Qualters Middle School.
Ownership History
Date
Name
Owned For
Owner Type
Purchase Details
Closed on
May 15, 2020
Sold by
Rego Richard P
Bought by
Rego Karen A and Rego Richard P
Current Estimated Value
Purchase Details
Closed on
Apr 24, 1995
Sold by
Adams Lloyd B and Adams Suzanne N
Bought by
Rego Richard P and Rego Richard P
Create a Home Valuation Report for This Property
The Home Valuation Report is an in-depth analysis detailing your home's value as well as a comparison with similar homes in the area
Home Values in the Area
Average Home Value in this Area
Purchase History
| Date | Buyer | Sale Price | Title Company |
|---|---|---|---|
| Rego Karen A | -- | None Available | |
| Rego Richard P | $220,250 | -- |
Source: Public Records
Mortgage History
| Date | Status | Borrower | Loan Amount |
|---|---|---|---|
| Previous Owner | Rego Richard P | $230,000 | |
| Previous Owner | Rego Richard P | $230,000 |
Source: Public Records
Tax History
| Year | Tax Paid | Tax Assessment Tax Assessment Total Assessment is a certain percentage of the fair market value that is determined by local assessors to be the total taxable value of land and additions on the property. | Land | Improvement |
|---|---|---|---|---|
| 2025 | $9,714 | $737,600 | $264,900 | $472,700 |
| 2024 | $10,269 | $760,700 | $276,400 | $484,300 |
| 2023 | $10,072 | $714,800 | $276,400 | $438,400 |
| 2022 | $9,650 | $636,100 | $255,900 | $380,200 |
| 2021 | $9,181 | $597,700 | $213,300 | $384,400 |
| 2020 | $8,738 | $568,900 | $213,300 | $355,600 |
| 2019 | $8,166 | $536,500 | $177,700 | $358,800 |
| 2018 | $7,528 | $518,500 | $169,300 | $349,200 |
| 2017 | $7,232 | $481,500 | $164,400 | $317,100 |
| 2016 | $6,640 | $430,900 | $156,500 | $274,400 |
| 2015 | $6,586 | $424,900 | $156,500 | $268,400 |
Source: Public Records
Map
Nearby Homes
- 2 Oak St Unit 2B
- 14 Claire Ave
- 451R Gilbert St
- 250 Mansfield Ave Unit 11
- 150 Gilbert St
- 71 Richardson Ave
- 343 Godfrey Dr
- 143 Oak St Unit 10
- 157 Mansfield Ave Unit 27
- 157 Mansfield Ave Unit 14
- 10 Walter St
- 49 Pheasant Hill Rd
- 128 Tremont St
- 19 Barberry Rd
- 20 John F. Kennedy Dr
- 4 Village Way Unit F
- 16 Holly Rd
- 345 Richardson Ave
- 24 Maverick Dr
- 21 Juniper Rd
Your Personal Tour Guide
Ask me questions while you tour the home.