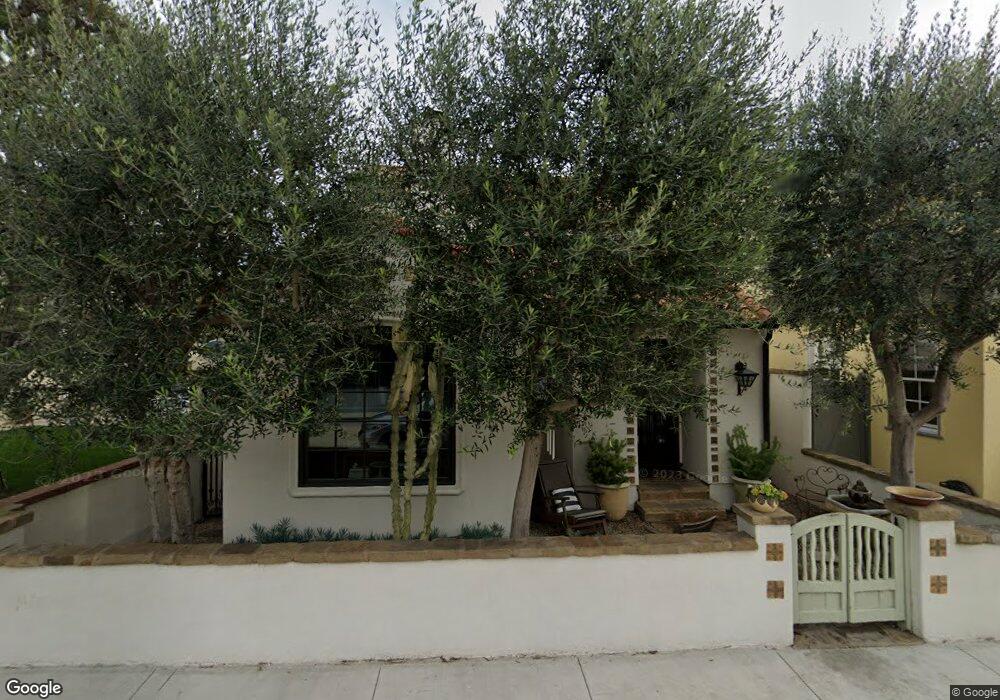
30 Giralda Walk Long Beach, CA 90803
Naples NeighborhoodEstimated Value: $1,538,000 - $2,302,000
3
Beds
2
Baths
1,732
Sq Ft
$1,037/Sq Ft
Est. Value
About This Home
This home is located at 30 Giralda Walk, Long Beach, CA 90803 and is currently estimated at $1,795,439, approximately $1,036 per square foot. 30 Giralda Walk is a home located in Los Angeles County with nearby schools including Naples Bayside Academy, Rogers Middle School, and Woodrow Wilson High School.
Ownership History
Date
Name
Owned For
Owner Type
Purchase Details
Closed on
Jan 19, 2006
Sold by
Clawson Michael H
Bought by
Clawson Michael H and Clawson Deborah R
Current Estimated Value
Purchase Details
Closed on
Nov 13, 1998
Sold by
Welling Glenn W
Bought by
Clawson Michael H and Clawson Deborah R
Home Financials for this Owner
Home Financials are based on the most recent Mortgage that was taken out on this home.
Original Mortgage
$200,000
Interest Rate
6.84%
Purchase Details
Closed on
Sep 22, 1997
Sold by
Welling Lauri A
Bought by
Welling Glenn W
Home Financials for this Owner
Home Financials are based on the most recent Mortgage that was taken out on this home.
Original Mortgage
$384,000
Interest Rate
7.49%
Purchase Details
Closed on
Aug 11, 1997
Sold by
Roberson Jacquelyn L
Bought by
Welling Glenn W
Home Financials for this Owner
Home Financials are based on the most recent Mortgage that was taken out on this home.
Original Mortgage
$384,000
Interest Rate
7.49%
Create a Home Valuation Report for This Property
The Home Valuation Report is an in-depth analysis detailing your home's value as well as a comparison with similar homes in the area
Home Values in the Area
Average Home Value in this Area
Purchase History
| Date | Buyer | Sale Price | Title Company |
|---|---|---|---|
| Clawson Michael H | -- | None Available | |
| Clawson Michael H | $575,000 | Equity Title Company | |
| Welling Glenn W | -- | Gateway Title Company | |
| Welling Glenn W | $480,000 | Gateway Title Company |
Source: Public Records
Mortgage History
| Date | Status | Borrower | Loan Amount |
|---|---|---|---|
| Closed | Clawson Michael H | $200,000 | |
| Previous Owner | Welling Glenn W | $384,000 |
Source: Public Records
Tax History
| Year | Tax Paid | Tax Assessment Tax Assessment Total Assessment is a certain percentage of the fair market value that is determined by local assessors to be the total taxable value of land and additions on the property. | Land | Improvement |
|---|---|---|---|---|
| 2025 | $11,191 | $901,421 | $587,887 | $313,534 |
| 2024 | $11,191 | $883,747 | $576,360 | $307,387 |
| 2023 | $11,005 | $866,419 | $565,059 | $301,360 |
| 2022 | $10,312 | $849,431 | $553,980 | $295,451 |
| 2021 | $10,122 | $832,776 | $543,118 | $289,658 |
| 2019 | $9,975 | $808,076 | $527,009 | $281,067 |
| 2018 | $9,709 | $792,232 | $516,676 | $275,556 |
| 2016 | $8,923 | $761,470 | $496,614 | $264,856 |
| 2015 | $8,557 | $750,033 | $489,155 | $260,878 |
| 2014 | $8,488 | $735,342 | $479,574 | $255,768 |
Source: Public Records
Map
Nearby Homes
- 86 Via di Roma Walk
- 11 Vista Del Golfo
- 5903 E Corso di Napoli
- 15 The Colonnade
- 29 W Neapolitan Ln
- 44 61st Place
- 44 59th Place
- 89 Rivo Alto Canal
- 5901 E Ocean Blvd
- 34 Rivo Alto Canal
- 6025 E Seaside Walk
- 32 56th Place
- 59 Rivo Alto Canal
- 5590 E The Toledo
- 10 66th Place
- 35 Geneva Walk
- 285 Ravenna Dr
- 111 Geneva Walk
- 6824 E Ocean Blvd
- 5503 E Ocean Blvd
- 28 Giralda Walk
- 34 Giralda Walk
- 26 Giralda Walk
- 36 Giralda Walk
- 24 Giralda Walk
- 31 Vista Del Golfo
- 29 Vista Del Golfo
- 33 Vista Del Golfo
- 33 Giralda Walk
- 27 Vista Del Golfo
- 38 Giralda Walk
- 35 Vista Del Golfo
- 24 Savona Walk
- 25 Vista Del Golfo
- 30 Savona Walk
- 20 Giralda Walk
- 7 Giralda Walk
- 41 Vista Del Golfo
- 39 Giralda Walk
- 23 Vista Del Golfo
Your Personal Tour Guide
Ask me questions while you tour the home.