Estimated Value: $528,616 - $579,000
2
Beds
3
Baths
1,189
Sq Ft
$459/Sq Ft
Est. Value
About This Home
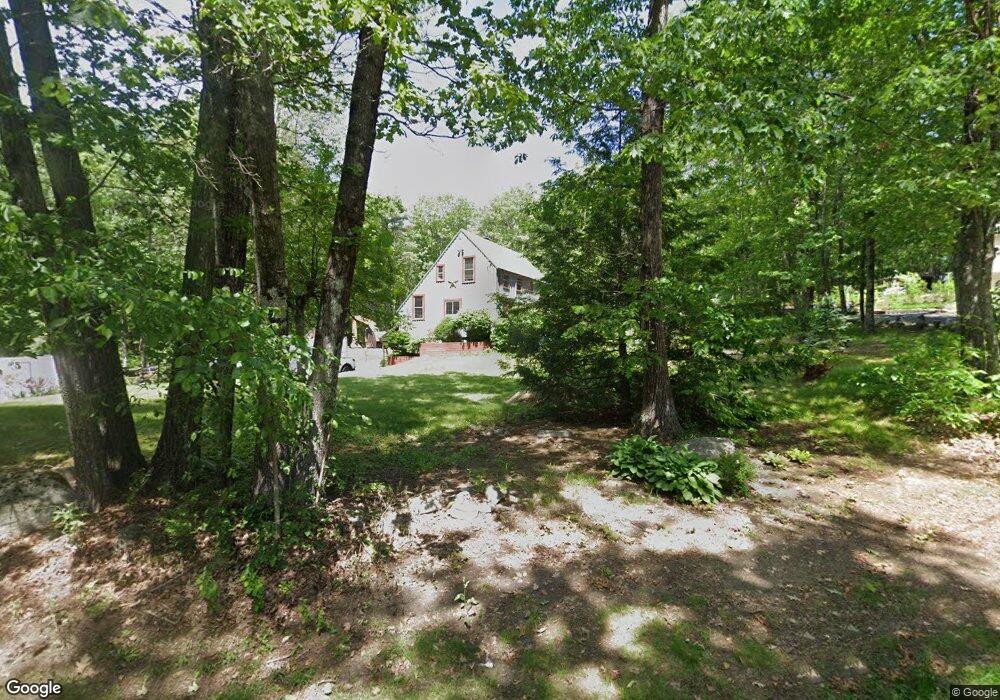
This home is located at 30 Gulf Rd, Derry, NH 03038 and is currently estimated at $546,154, approximately $459 per square foot. 30 Gulf Rd is a home located in Rockingham County with nearby schools including East Derry Memorial Elementary School, West Running Brook Middle School, and Pinkerton Academy.
Ownership History
Date
Name
Owned For
Owner Type
Purchase Details
Closed on
Sep 15, 2020
Sold by
Garside Donald R and Garside Michelle A
Bought by
Garside Ft
Current Estimated Value
Purchase Details
Closed on
Mar 30, 2001
Sold by
Eckhaus Larry S and Eckhaus Barbara C
Bought by
Garside Donald R and Garside Michelle A
Home Financials for this Owner
Home Financials are based on the most recent Mortgage that was taken out on this home.
Original Mortgage
$188,450
Interest Rate
6.96%
Create a Home Valuation Report for This Property
The Home Valuation Report is an in-depth analysis detailing your home's value as well as a comparison with similar homes in the area
Home Values in the Area
Average Home Value in this Area
Purchase History
| Date | Buyer | Sale Price | Title Company |
|---|---|---|---|
| Garside Ft | -- | None Available | |
| Garside Donald R | $190,000 | -- |
Source: Public Records
Mortgage History
| Date | Status | Borrower | Loan Amount |
|---|---|---|---|
| Previous Owner | Garside Donald R | $177,400 | |
| Previous Owner | Garside Donald R | $79,900 | |
| Previous Owner | Garside Donald R | $188,450 |
Source: Public Records
Tax History Compared to Growth
Tax History
| Year | Tax Paid | Tax Assessment Tax Assessment Total Assessment is a certain percentage of the fair market value that is determined by local assessors to be the total taxable value of land and additions on the property. | Land | Improvement |
|---|---|---|---|---|
| 2024 | $8,463 | $452,800 | $235,900 | $216,900 |
| 2023 | $8,156 | $394,400 | $200,500 | $193,900 |
| 2022 | $7,509 | $394,400 | $200,500 | $193,900 |
| 2021 | $7,317 | $295,500 | $160,400 | $135,100 |
| 2020 | $7,192 | $295,500 | $160,400 | $135,100 |
| 2019 | $7,201 | $275,700 | $130,800 | $144,900 |
| 2018 | $7,422 | $275,700 | $130,800 | $144,900 |
| 2017 | $6,552 | $249,400 | $125,800 | $123,600 |
| 2016 | $6,749 | $249,400 | $125,800 | $123,600 |
| 2015 | $6,600 | $225,800 | $125,800 | $100,000 |
| 2014 | $6,643 | $225,800 | $125,800 | $100,000 |
| 2013 | $6,899 | $219,100 | $117,800 | $101,300 |
Source: Public Records
Map
Nearby Homes
- 35 Steele Rd
- 6 Weston St
- 242 Rockingham Rd
- 3 Anna Cir
- 114 Chases Grove Rd
- 116 Chases Grove Rd
- 120 Chases Grove Rd
- 2 Remington Ct
- 117C Chases Grove Rd
- 18 Lorri Rd
- 29 Hawk Dr
- 16 Autumn Woods Rd
- 67 & 69 Conleys Grove Rd
- 22 Jacob Rd
- 7 Evergreen Way
- 4 Colony Brook Ln
- 3 Evergreen Way
- 2 Kinsman Ln
- 5A Homestead Dr Unit A
- 5A Homestead Dr