Estimated Value: $81,000 - $247,000
--
Bed
--
Bath
4,608
Sq Ft
$39/Sq Ft
Est. Value
About This Home
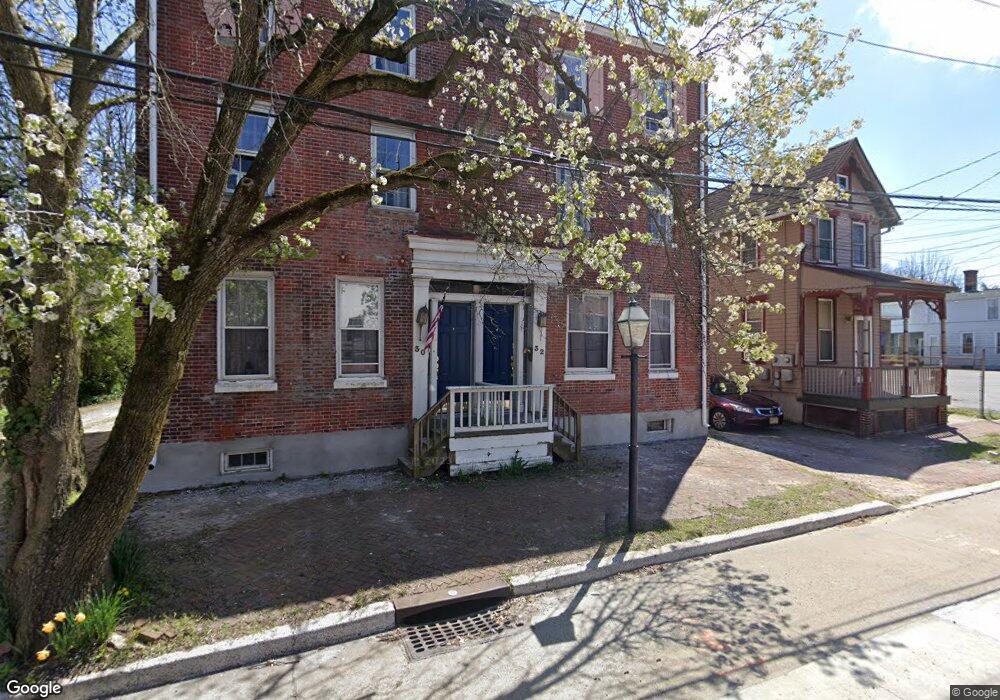
This home is located at 30 Market St Unit 32, Salem, NJ 08079 and is currently estimated at $181,034, approximately $39 per square foot. 30 Market St Unit 32 is a home located in Salem County with nearby schools including John Fenwick Elementary School, Salem Middle School, and Salem High School.
Ownership History
Date
Name
Owned For
Owner Type
Purchase Details
Closed on
Jan 24, 2023
Sold by
Gerkin Bob
Bought by
Beach Buster Llc
Current Estimated Value
Home Financials for this Owner
Home Financials are based on the most recent Mortgage that was taken out on this home.
Original Mortgage
$162,000
Outstanding Balance
$156,879
Interest Rate
6.48%
Mortgage Type
Construction
Estimated Equity
$24,155
Purchase Details
Closed on
Mar 17, 2022
Sold by
Lynn Butler Frank
Bought by
Gerkin Bob
Purchase Details
Closed on
Mar 6, 2015
Sold by
Citimortgage Inc
Bought by
Federal Home Loan Mortgage Corp
Purchase Details
Closed on
Jun 3, 1999
Sold by
Marrone Harry D and Marrone Roberta M
Bought by
Rivell Sandra J
Home Financials for this Owner
Home Financials are based on the most recent Mortgage that was taken out on this home.
Original Mortgage
$75,600
Interest Rate
6.85%
Create a Home Valuation Report for This Property
The Home Valuation Report is an in-depth analysis detailing your home's value as well as a comparison with similar homes in the area
Home Values in the Area
Average Home Value in this Area
Purchase History
| Date | Buyer | Sale Price | Title Company |
|---|---|---|---|
| Beach Buster Llc | $100,000 | American Title | |
| Gerkin Bob | $52,000 | Homestead Title | |
| Gerkin Bob | $52,000 | Homestead Title | |
| Federal Home Loan Mortgage Corp | -- | None Available | |
| Rivell Sandra J | $84,000 | Intercoastal Title Agency In |
Source: Public Records
Mortgage History
| Date | Status | Borrower | Loan Amount |
|---|---|---|---|
| Open | Beach Buster Llc | $162,000 | |
| Previous Owner | Rivell Sandra J | $75,600 |
Source: Public Records
Tax History Compared to Growth
Tax History
| Year | Tax Paid | Tax Assessment Tax Assessment Total Assessment is a certain percentage of the fair market value that is determined by local assessors to be the total taxable value of land and additions on the property. | Land | Improvement |
|---|---|---|---|---|
| 2025 | $4,867 | $59,200 | $7,300 | $51,900 |
| 2024 | $4,654 | $59,200 | $7,300 | $51,900 |
| 2023 | $4,654 | $59,200 | $7,300 | $51,900 |
| 2022 | $4,450 | $59,200 | $7,300 | $51,900 |
| 2021 | $4,297 | $59,200 | $7,300 | $51,900 |
| 2020 | $4,210 | $59,200 | $7,300 | $51,900 |
| 2019 | $4,185 | $59,200 | $7,300 | $51,900 |
| 2018 | $4,093 | $59,200 | $7,300 | $51,900 |
| 2017 | $4,043 | $59,200 | $7,300 | $51,900 |
| 2016 | $7,738 | $197,600 | $41,800 | $155,800 |
| 2015 | $7,639 | $197,600 | $41,800 | $155,800 |
| 2014 | -- | $197,600 | $41,800 | $155,800 |
Source: Public Records
Map
Nearby Homes