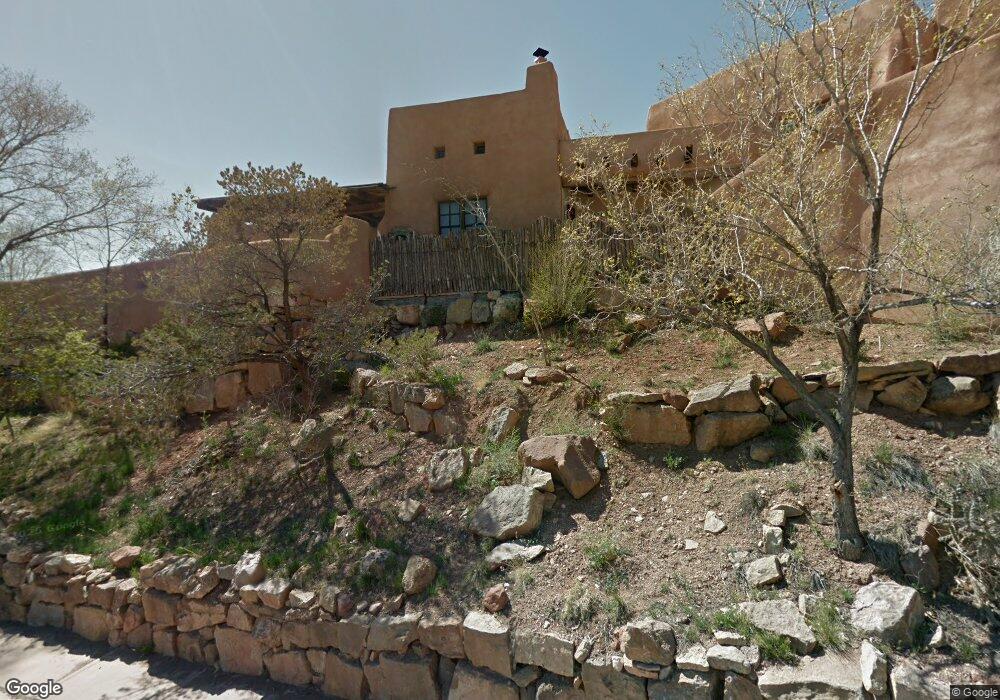
30 Montoya Cir Santa Fe, NM 87501
North Hills NeighborhoodEstimated Value: $1,129,608 - $1,297,000
3
Beds
4
Baths
2,131
Sq Ft
$577/Sq Ft
Est. Value
About This Home
This home is located at 30 Montoya Cir, Santa Fe, NM 87501 and is currently estimated at $1,229,652, approximately $577 per square foot. 30 Montoya Cir is a home located in Santa Fe County with nearby schools including Acequia Madre Elementary School, Santa Fe High School, and Desert Montessori School.
Ownership History
Date
Name
Owned For
Owner Type
Purchase Details
Closed on
Jun 20, 2016
Sold by
Powell Athony G and Powell Corey A
Bought by
Powell Anthony G
Current Estimated Value
Purchase Details
Closed on
Jul 12, 2010
Sold by
Vanpoucke Eric
Bought by
Powell Anthony G
Purchase Details
Closed on
Jul 9, 2010
Sold by
Powell Anthony G
Bought by
Powell Anthony G and Powell Corey A
Purchase Details
Closed on
Sep 25, 2006
Sold by
Florey Properties Llc
Bought by
Vanpoucke Eric
Home Financials for this Owner
Home Financials are based on the most recent Mortgage that was taken out on this home.
Original Mortgage
$887,500
Interest Rate
7.87%
Mortgage Type
New Conventional
Purchase Details
Closed on
Nov 25, 2002
Sold by
Coleman Melissa Tallent
Bought by
Florey Properties Llc
Home Financials for this Owner
Home Financials are based on the most recent Mortgage that was taken out on this home.
Original Mortgage
$480,000
Interest Rate
5.89%
Create a Home Valuation Report for This Property
The Home Valuation Report is an in-depth analysis detailing your home's value as well as a comparison with similar homes in the area
Home Values in the Area
Average Home Value in this Area
Purchase History
| Date | Buyer | Sale Price | Title Company |
|---|---|---|---|
| Powell Anthony G | -- | None Available | |
| Powell Anthony G | -- | Rio Grande Title Company Inc | |
| Powell Anthony G | -- | Accommodation | |
| Vanpoucke Eric | -- | Quiet Title Co Llc | |
| Florey Properties Llc | -- | First American Title Ins Co |
Source: Public Records
Mortgage History
| Date | Status | Borrower | Loan Amount |
|---|---|---|---|
| Previous Owner | Vanpoucke Eric | $887,500 | |
| Previous Owner | Florey Properties Llc | $480,000 |
Source: Public Records
Tax History Compared to Growth
Tax History
| Year | Tax Paid | Tax Assessment Tax Assessment Total Assessment is a certain percentage of the fair market value that is determined by local assessors to be the total taxable value of land and additions on the property. | Land | Improvement |
|---|---|---|---|---|
| 2024 | $3,834 | $521,121 | $139,751 | $381,370 |
| 2023 | $3,830 | $505,944 | $135,681 | $370,263 |
| 2022 | $3,883 | $491,209 | $131,730 | $359,479 |
| 2021 | $3,823 | $158,968 | $42,631 | $116,337 |
| 2020 | $3,709 | $154,338 | $42,631 | $111,707 |
| 2019 | $3,657 | $149,843 | $66,666 | $83,177 |
| 2018 | $3,625 | $147,467 | $66,666 | $80,801 |
| 2017 | $3,582 | $145,090 | $66,666 | $78,424 |
| 2016 | $3,465 | $144,547 | $66,667 | $77,880 |
| 2015 | $3,385 | $140,337 | $66,667 | $73,670 |
| 2014 | $3,468 | $148,295 | $66,600 | $81,695 |
Source: Public Records
Map
Nearby Homes
- 5 Cerro Gordo Rd Unit 1
- 1 Cerro Gordo Rd Unit B
- 259 Montoya Cir Unit 2
- 868 E Alameda St
- 942 Canyon Rd Unit A & B
- 924 Canyon Rd
- 653 Canyon Rd Unit 11
- 808 La Vereda Este
- 800 La Vereda Este
- 630 E Alameda St Unit A, B, C, E, F, G & I
- 812 La Vereda Este
- 1018 1/2 Canyon Rd
- 707 E Palace Ave Unit 8
- 707 E Palace Ave Unit 11
- 113 Cantera Cir
- 420 Camino Don Miguel
- 637 E Alameda St
- 634 Canyon Rd
- 1047B Camino San Acacio
- 414 A and B Camino Don Miguel
- 102 Montoya Cir
- 102 Montoya Cir
- 102 Montoya Cir
- 32 Montoya Cir
- 230 Montoya Cir
- 12 Montoya Cir
- 3 Montoya Cir
- 2 Montoya Cir
- 31 Montoya Cir
- 224 Montoya Cir Unit 1 C
- 224 Montoya Cir
- 20 Montoya Cir
- 4 Montoya Cir
- 184 Montoya Cir
- 5 Montoya Cir
- 21 Montoya Cir
- 223 Montoya Cir
- 259 Montoya Cir Unit 2
- 259 Montoya Cir
- 259 Montoya Cir Unit 1