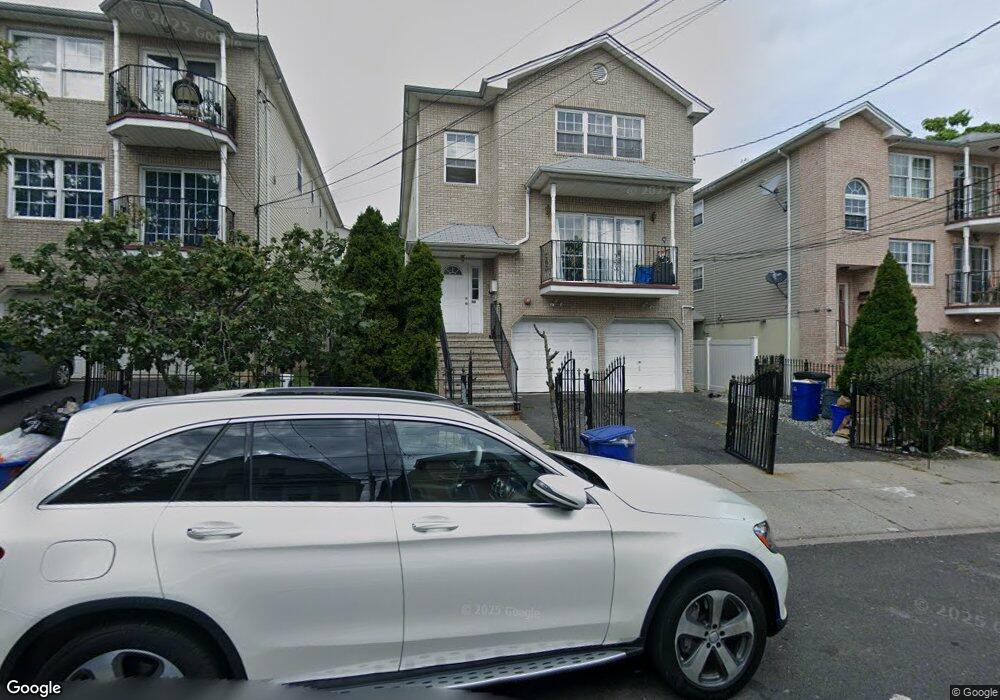
30 N 5th St Unit 3 Newark, NJ 07107
Fairmount NeighborhoodEstimated Value: $382,000 - $917,000
--
Bed
2
Baths
3,208
Sq Ft
$220/Sq Ft
Est. Value
About This Home
This home is located at 30 N 5th St Unit 3, Newark, NJ 07107 and is currently estimated at $704,504, approximately $219 per square foot. 30 N 5th St Unit 3 is a home located in Essex County with nearby schools including Sir Isaac Newton Elementary School, Camden Street Elementary School, and Cleveland Elementary School.
Ownership History
Date
Name
Owned For
Owner Type
Purchase Details
Closed on
Feb 27, 2008
Current Estimated Value
Home Financials for this Owner
Home Financials are based on the most recent Mortgage that was taken out on this home.
Original Mortgage
$482,282
Interest Rate
5.8%
Mortgage Type
FHA
Create a Home Valuation Report for This Property
The Home Valuation Report is an in-depth analysis detailing your home's value as well as a comparison with similar homes in the area
Home Values in the Area
Average Home Value in this Area
Purchase History
| Date | Buyer | Sale Price | Title Company |
|---|---|---|---|
| -- | -- | -- | |
| Pina Ramon | $490,000 | Chicago Title Insurance Co |
Source: Public Records
Mortgage History
| Date | Status | Borrower | Loan Amount |
|---|---|---|---|
| Previous Owner | Pina Ramon | $482,282 |
Source: Public Records
Tax History Compared to Growth
Tax History
| Year | Tax Paid | Tax Assessment Tax Assessment Total Assessment is a certain percentage of the fair market value that is determined by local assessors to be the total taxable value of land and additions on the property. | Land | Improvement |
|---|---|---|---|---|
| 2025 | $10,181 | $273,100 | $23,100 | $250,000 |
| 2024 | $10,181 | $273,100 | $23,100 | $250,000 |
| 2022 | $10,203 | $273,100 | $23,100 | $250,000 |
| 2021 | $10,198 | $273,100 | $23,100 | $250,000 |
| 2020 | $10,378 | $273,100 | $23,100 | $250,000 |
| 2019 | $10,271 | $273,100 | $23,100 | $250,000 |
| 2018 | $10,086 | $273,100 | $23,100 | $250,000 |
| 2017 | $9,722 | $273,100 | $23,100 | $250,000 |
| 2016 | $9,395 | $273,100 | $23,100 | $250,000 |
| 2015 | $9,037 | $273,100 | $23,100 | $250,000 |
| 2014 | $8,469 | $273,100 | $23,100 | $250,000 |
Source: Public Records
Map
Nearby Homes