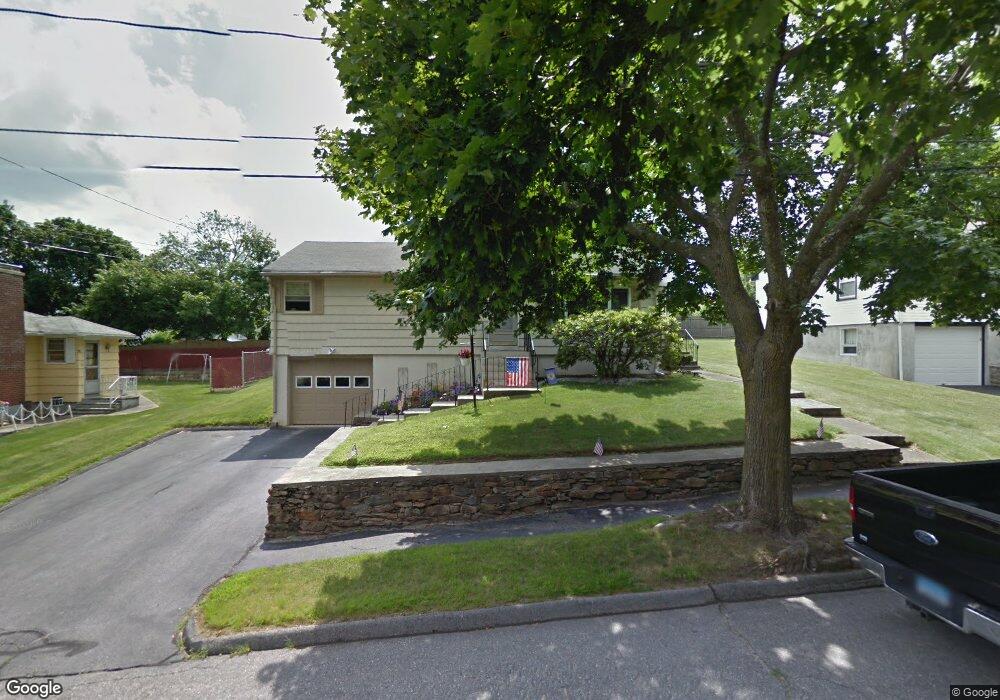
30 Robin Rd Worcester, MA 01604
Hamilton NeighborhoodEstimated Value: $387,000 - $435,000
3
Beds
1
Bath
1,284
Sq Ft
$318/Sq Ft
Est. Value
About This Home
This home is located at 30 Robin Rd, Worcester, MA 01604 and is currently estimated at $407,676, approximately $317 per square foot. 30 Robin Rd is a home located in Worcester County with nearby schools including Jacob Hiatt Magnet School, Chandler Magnet, and Rice Square Elementary School.
Ownership History
Date
Name
Owned For
Owner Type
Purchase Details
Closed on
Oct 29, 1999
Sold by
Moran James P and Moran Mary R
Bought by
Steinhart Paul G and Steinhart Kathleen O
Current Estimated Value
Home Financials for this Owner
Home Financials are based on the most recent Mortgage that was taken out on this home.
Original Mortgage
$60,000
Interest Rate
7.78%
Mortgage Type
Purchase Money Mortgage
Create a Home Valuation Report for This Property
The Home Valuation Report is an in-depth analysis detailing your home's value as well as a comparison with similar homes in the area
Home Values in the Area
Average Home Value in this Area
Purchase History
| Date | Buyer | Sale Price | Title Company |
|---|---|---|---|
| Steinhart Paul G | $105,000 | -- |
Source: Public Records
Mortgage History
| Date | Status | Borrower | Loan Amount |
|---|---|---|---|
| Open | Steinhart Paul G | $54,500 | |
| Closed | Steinhart Paul G | $60,000 | |
| Previous Owner | Steinhart Paul G | $25,000 | |
| Previous Owner | Steinhart Paul G | $15,000 |
Source: Public Records
Tax History
| Year | Tax Paid | Tax Assessment Tax Assessment Total Assessment is a certain percentage of the fair market value that is determined by local assessors to be the total taxable value of land and additions on the property. | Land | Improvement |
|---|---|---|---|---|
| 2025 | $4,954 | $375,600 | $117,600 | $258,000 |
| 2024 | $4,848 | $352,600 | $117,600 | $235,000 |
| 2023 | $4,691 | $327,100 | $102,300 | $224,800 |
| 2022 | $4,157 | $273,300 | $81,800 | $191,500 |
| 2021 | $4,086 | $251,000 | $65,400 | $185,600 |
| 2020 | $4,000 | $235,300 | $65,500 | $169,800 |
| 2019 | $3,758 | $208,800 | $58,900 | $149,900 |
| 2018 | $3,638 | $192,400 | $58,900 | $133,500 |
| 2017 | $3,698 | $192,400 | $58,900 | $133,500 |
| 2016 | $3,615 | $175,400 | $42,800 | $132,600 |
| 2015 | $3,520 | $175,400 | $42,800 | $132,600 |
| 2014 | $3,427 | $175,400 | $42,800 | $132,600 |
Source: Public Records
Map
Nearby Homes
- 34 Robin Rd
- 81 Pilgrim Ave
- 155 Hamilton St Unit 4
- 80 Delmont Ave
- 61 Cohasset St
- 56 Plantation St
- 13 Groton Place
- 5 Mcfarland Ct
- 143 Dorcester
- 247 Shrewsbury St
- 429 Grafton St Unit 2
- 35 Houghton St
- 293 Harrington Way
- 1 Verdi Rd
- 57 Cutler St
- 9 Barclay St
- 360 Hamilton St
- 112 Harrison St
- 29 Chilmark St
- 40 Aetna St
Your Personal Tour Guide
Ask me questions while you tour the home.