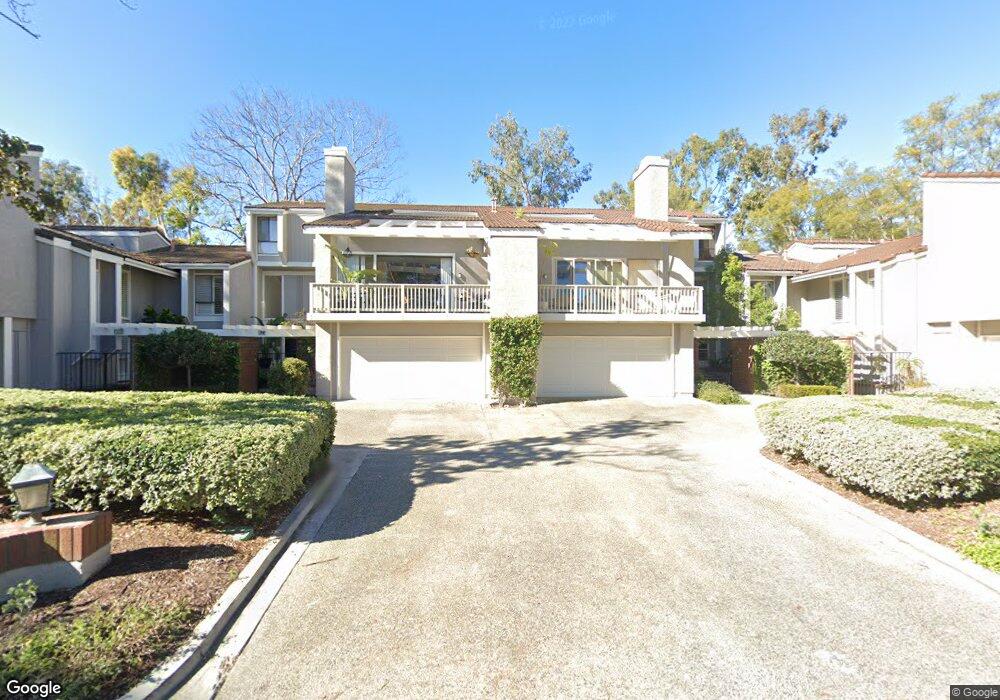
30 Rocky Knoll Unit 29 Irvine, CA 92612
Turtle Rock NeighborhoodEstimated Value: $1,574,000 - $1,733,502
3
Beds
2
Baths
2,544
Sq Ft
$652/Sq Ft
Est. Value
About This Home
This home is located at 30 Rocky Knoll Unit 29, Irvine, CA 92612 and is currently estimated at $1,657,626, approximately $651 per square foot. 30 Rocky Knoll Unit 29 is a home located in Orange County with nearby schools including Turtle Rock Elementary, Rancho San Joaquin Middle School, and University High School.
Ownership History
Date
Name
Owned For
Owner Type
Purchase Details
Closed on
Sep 9, 2009
Sold by
Hoogstad Sheila Ann
Bought by
Hoogstad Sheila Ann and Sheila Ann Hoogstad Separate Property Re
Current Estimated Value
Purchase Details
Closed on
Aug 11, 2004
Sold by
Hoogstad Sheila Ann
Bought by
Hoogstad Sheila Ann and The Hoogstad Family Trust
Purchase Details
Closed on
Jul 29, 1999
Sold by
Peter Hoogstad and Peter Sheila
Bought by
Hoogstad Peter Arie and Hoogstad Sheila Ann
Purchase Details
Closed on
Mar 28, 1996
Sold by
Newgen Joel Francis and Newgen Dorothy W
Bought by
Hoogstad Peter A and Hoogstad Sheila A
Home Financials for this Owner
Home Financials are based on the most recent Mortgage that was taken out on this home.
Original Mortgage
$184,300
Interest Rate
7.8%
Create a Home Valuation Report for This Property
The Home Valuation Report is an in-depth analysis detailing your home's value as well as a comparison with similar homes in the area
Home Values in the Area
Average Home Value in this Area
Purchase History
| Date | Buyer | Sale Price | Title Company |
|---|---|---|---|
| Hoogstad Sheila Ann | -- | None Available | |
| Hoogstad Sheila Ann | -- | -- | |
| Hoogstad Peter Arie | -- | -- | |
| Hoogstad Peter A | $317,500 | Old Republic Title Company |
Source: Public Records
Mortgage History
| Date | Status | Borrower | Loan Amount |
|---|---|---|---|
| Previous Owner | Hoogstad Peter A | $184,300 |
Source: Public Records
Tax History Compared to Growth
Tax History
| Year | Tax Paid | Tax Assessment Tax Assessment Total Assessment is a certain percentage of the fair market value that is determined by local assessors to be the total taxable value of land and additions on the property. | Land | Improvement |
|---|---|---|---|---|
| 2025 | $5,458 | $527,442 | $232,707 | $294,735 |
| 2024 | $5,458 | $517,100 | $228,144 | $288,956 |
| 2023 | $5,316 | $506,961 | $223,670 | $283,291 |
| 2022 | $5,219 | $497,021 | $219,284 | $277,737 |
| 2021 | $5,102 | $487,276 | $214,984 | $272,292 |
| 2020 | $5,072 | $482,280 | $212,780 | $269,500 |
| 2019 | $4,958 | $472,824 | $208,608 | $264,216 |
| 2018 | $4,868 | $463,553 | $204,517 | $259,036 |
| 2017 | $4,767 | $454,464 | $200,507 | $253,957 |
| 2016 | $4,554 | $445,553 | $196,575 | $248,978 |
| 2015 | $4,538 | $438,861 | $193,622 | $245,239 |
| 2014 | $4,450 | $430,265 | $189,829 | $240,436 |
Source: Public Records
Map
Nearby Homes
- 15 Rocky Knoll
- 21 Rustling Wind
- 4886 Paseo de Vega
- 18802 Saginaw Dr
- 18816 Saginaw Dr
- 17 Wandering Rill
- 10 Lassen
- 19 Rippling Stream
- 16 Wellesley Unit 2
- 53 Wellesley Unit 50
- 53 Oxford Unit 14
- 17692 Cassia Tree Ln
- 21 Centaurus
- 3 Whitewood Way
- 22 Meadowsweet Way
- 17 Oxford Unit 28
- 6 Mandrake Way
- 3 Longbourn Aisle
- 17 Brigadier
- 19112 Biddle Dr
- 22 Rocky Knoll
- 23 Rocky Knoll Unit 10
- 21 Rocky Knoll Unit 11
- 23 Rocky Knoll
- 16 Rocky Knoll Unit 8
- 15 Rocky Knoll Unit 10
- 17 Rocky Knoll Unit 9
- 16 Rocky Knoll
- 13 Rocky Knoll
- 8 Daystar
- 38 Rocky Knoll Unit 25
- 38 Rocky Knoll
- 14 Rocky Knoll
- 10 Daystar
- 1 Daystar
- 10 Rocky Knoll Unit 5
- 37 Rocky Knoll Unit 31
- 37 Rocky Knoll
- 3 Daystar
- 12 Daystar