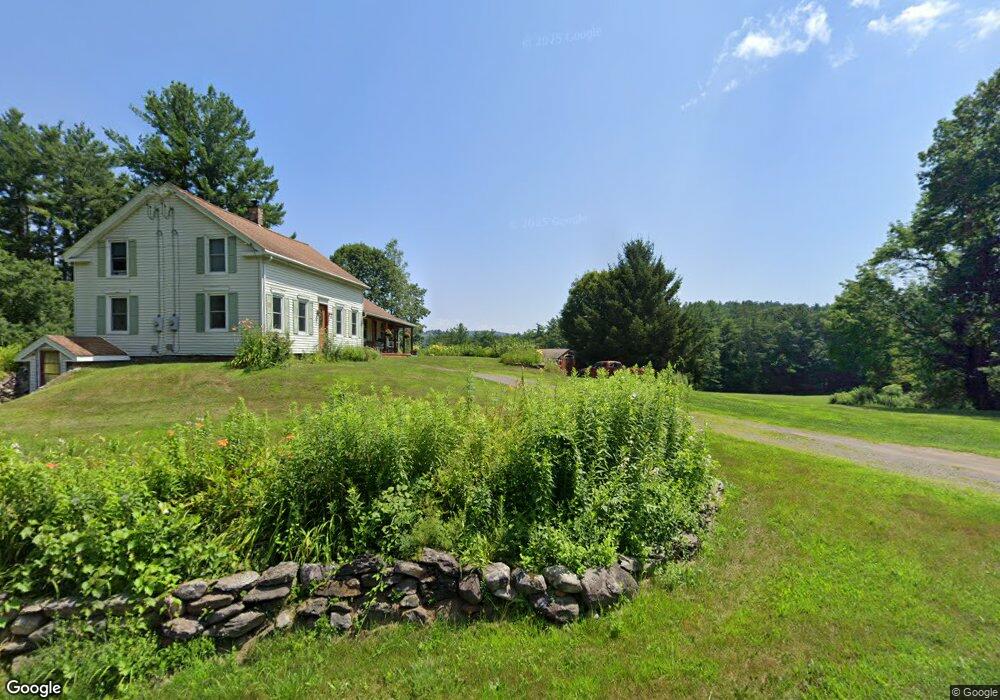
30 Shelburne Line Rd Colrain, MA 01340
Colrain NeighborhoodEstimated Value: $290,000 - $379,000
4
Beds
1
Bath
1,600
Sq Ft
$203/Sq Ft
Est. Value
About This Home
This home is located at 30 Shelburne Line Rd, Colrain, MA 01340 and is currently estimated at $325,166, approximately $203 per square foot. 30 Shelburne Line Rd is a home located in Franklin County with nearby schools including Mohawk Trail Regional High School.
Ownership History
Date
Name
Owned For
Owner Type
Purchase Details
Closed on
May 28, 2025
Sold by
Tozloski Brenda and Tozloski Dennis C
Bought by
Mitchell Matthew
Current Estimated Value
Home Financials for this Owner
Home Financials are based on the most recent Mortgage that was taken out on this home.
Original Mortgage
$175,000
Outstanding Balance
$173,610
Interest Rate
5.38%
Mortgage Type
Purchase Money Mortgage
Estimated Equity
$151,556
Purchase Details
Closed on
Jan 17, 2019
Sold by
Tozloski Brenda
Bought by
Tozloski Brenda and Tozloski Dennis C
Purchase Details
Closed on
Sep 29, 2006
Sold by
Mitchell Brenda and Mitchell Chester D
Bought by
Mitchell Brenda H
Purchase Details
Closed on
Jun 20, 1997
Sold by
Carpenter Donald H and Carpenter Elizabeth R
Bought by
Mitchell Chester D and Mitchell Brenda
Create a Home Valuation Report for This Property
The Home Valuation Report is an in-depth analysis detailing your home's value as well as a comparison with similar homes in the area
Home Values in the Area
Average Home Value in this Area
Purchase History
| Date | Buyer | Sale Price | Title Company |
|---|---|---|---|
| Mitchell Matthew | $250,000 | None Available | |
| Mitchell Matthew | $250,000 | None Available | |
| Tozloski Brenda | -- | None Available | |
| Tozloski Brenda | -- | None Available | |
| Mitchell Brenda H | -- | -- | |
| Mitchell Brenda H | -- | -- | |
| Mitchell Brenda H | -- | -- | |
| Mitchell Chester D | $65,000 | -- | |
| Mitchell Chester D | $65,000 | -- |
Source: Public Records
Mortgage History
| Date | Status | Borrower | Loan Amount |
|---|---|---|---|
| Open | Mitchell Matthew | $175,000 | |
| Closed | Mitchell Matthew | $175,000 | |
| Previous Owner | Mitchell Chester D | $31,400 | |
| Previous Owner | Mitchell Chester D | $146,000 |
Source: Public Records
Tax History
| Year | Tax Paid | Tax Assessment Tax Assessment Total Assessment is a certain percentage of the fair market value that is determined by local assessors to be the total taxable value of land and additions on the property. | Land | Improvement |
|---|---|---|---|---|
| 2025 | $3,619 | $198,200 | $61,500 | $136,700 |
| 2024 | $3,762 | $198,200 | $61,500 | $136,700 |
| 2023 | $3,875 | $197,400 | $60,700 | $136,700 |
| 2022 | $3,727 | $182,000 | $53,900 | $128,100 |
| 2021 | $4,069 | $192,300 | $64,200 | $128,100 |
| 2020 | $3,835 | $192,400 | $64,200 | $128,200 |
| 2019 | $3,686 | $179,200 | $64,200 | $115,000 |
| 2018 | $3,627 | $179,200 | $64,200 | $115,000 |
| 2017 | $3,367 | $170,900 | $55,900 | $115,000 |
| 2016 | $3,194 | $171,000 | $55,900 | $115,100 |
| 2015 | $3,093 | $171,000 | $55,900 | $115,100 |
Source: Public Records
Map
Nearby Homes
- 71 George Lamb Rd
- 151 Smead Hill Rd
- 295 Jacksonville Rd
- 25 Barton Rd
- 714 Colrain Rd
- 34 Brookside Ave
- 187 Plain Rd
- 539 Fox Hill Rd
- 4 Pickett Ln
- Lot 9 Fox Hill Rd (Off)
- 6 Pickett Ln
- 75 South St Unit 3
- 132 Poplar St
- 77 Summer St
- 0 Fox Hill Rd Unit 73477185
- 6 Burrows Turnpike Rd
- 696 Bernardston Rd
- 56 Brattleboro Rd
- 2155 Massachusetts 2
- 414 Mohawk Trail
- 42 Shelburne Line Rd
- 19 Shelburne Line Rd
- 100 Fort Lucas Rd
- 14 Shelburne Line Rd
- 64 Shelburne Line Rd
- 114 Fort Lucas Rd
- 153 W Leyden Rd
- 127 W Leyden Rd
- 165 W Leyden Rd
- 160 W Leyden Rd
- 140 W Leyden Rd
- 136 W Leyden Rd
- 12 E Colrain Rd
- 12 E Colrain Rd
- 00 E Colrain Rd
- 0 E Colrain Rd
- 44 E Colrain Rd
- 179 W Leyden Rd
- 87 Shelburne Line Rd
- 5 Phillips Dr
Your Personal Tour Guide
Ask me questions while you tour the home.