30 Tournament Tee Dr Unit 708B O Fallon, MO 63368
Estimated Value: $367,000 - $397,000
2
Beds
3
Baths
3,720
Sq Ft
$103/Sq Ft
Est. Value
About This Home
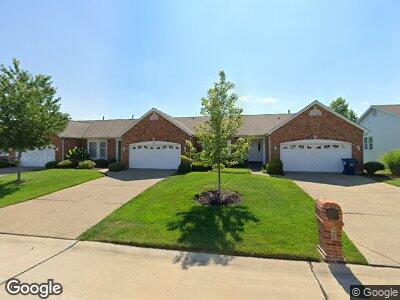
This home is located at 30 Tournament Tee Dr Unit 708B, O Fallon, MO 63368 and is currently estimated at $383,082, approximately $102 per square foot. 30 Tournament Tee Dr Unit 708B is a home located in St. Charles County with nearby schools including Immaculate Conception Catholic School, Primrose School of O'Fallon at WingHaven, and Guidepost Montessori at O'Fallon.
Ownership History
Date
Name
Owned For
Owner Type
Purchase Details
Closed on
Nov 6, 2014
Sold by
Dougherty Nancy J and Patrick & Nancy J Dougherty Re
Bought by
Dougherty Nancy J
Current Estimated Value
Purchase Details
Closed on
Jul 19, 2004
Sold by
Master Financial Inc
Bought by
Dougherty Patrick J and Dougherty Nancy J
Home Financials for this Owner
Home Financials are based on the most recent Mortgage that was taken out on this home.
Original Mortgage
$115,000
Interest Rate
5.66%
Mortgage Type
Purchase Money Mortgage
Purchase Details
Closed on
Mar 15, 2004
Sold by
Kitchen Lawrence R and Kitchen Carolyn M
Bought by
Master Financial Inc
Purchase Details
Closed on
Jan 31, 2001
Sold by
Whittaker Construction Inc
Bought by
Kitchen Lawrence R and Kitchen Carolyn M
Home Financials for this Owner
Home Financials are based on the most recent Mortgage that was taken out on this home.
Original Mortgage
$176,467
Interest Rate
7.21%
Mortgage Type
VA
Create a Home Valuation Report for This Property
The Home Valuation Report is an in-depth analysis detailing your home's value as well as a comparison with similar homes in the area
Home Values in the Area
Average Home Value in this Area
Purchase History
| Date | Buyer | Sale Price | Title Company |
|---|---|---|---|
| Dougherty Nancy J | -- | None Available | |
| Dougherty Patrick J | $192,000 | Inv | |
| Master Financial Inc | $198,000 | -- | |
| Kitchen Lawrence R | -- | -- |
Source: Public Records
Mortgage History
| Date | Status | Borrower | Loan Amount |
|---|---|---|---|
| Open | Dougherty Nancy J | $37,500 | |
| Open | Dougherty Patrick J | $117,900 | |
| Previous Owner | Dougherty Patrick J | $115,000 | |
| Previous Owner | Kitchen Lawrence R | $176,467 |
Source: Public Records
Tax History Compared to Growth
Tax History
| Year | Tax Paid | Tax Assessment Tax Assessment Total Assessment is a certain percentage of the fair market value that is determined by local assessors to be the total taxable value of land and additions on the property. | Land | Improvement |
|---|---|---|---|---|
| 2023 | $3,940 | $63,244 | $0 | $0 |
| 2022 | $3,573 | $53,317 | $0 | $0 |
| 2021 | $3,571 | $53,317 | $0 | $0 |
| 2020 | $3,065 | $44,188 | $0 | $0 |
| 2019 | $3,055 | $44,188 | $0 | $0 |
| 2018 | $3,127 | $43,277 | $0 | $0 |
| 2017 | $3,111 | $43,277 | $0 | $0 |
| 2016 | $2,878 | $39,905 | $0 | $0 |
| 2015 | $2,644 | $39,905 | $0 | $0 |
| 2014 | $2,625 | $38,671 | $0 | $0 |
Source: Public Records
Map
Nearby Homes
- 2339 Hidden Deer Dr
- 2 Coalter Ct
- 2177 Mcgregor Cir
- 6965 Brassel Dr
- 81 Chicory Ct
- 6 Rock Church Dr
- 6926 Emmons Dr
- 33 Horsetail Ct
- 7302 Macleod Ln
- 7 Green Heron Ct
- 9 Farnsworth Ct Unit A
- 20 Farnsworth Ct Unit D
- 2 Macleod Ct
- 7219 Watsons Parish Dr
- 2611 Tysons Ct
- 537 Montrachet Dr
- 2329 Plum Grove Dr
- 1166 Saint Theresa Dr
- 783 Thunder Hill Dr
- 102 Lamplighter Way
- 30 Tournament Tee Dr Unit 708B
- 32 Tournament Tee Dr
- 32 Tournament Tee Dr Unit 708A
- 28 Tournament Tee Dr
- 34 Tournament Tee Dr
- 2624 Samuel Dr
- 26 Tournament Tee Dr
- 26 Tournament Tee Dr Unit 709A
- 2622 Samuel Dr
- 2622 Samuel Dr Unit 712C
- 2620 Samuel Dr Unit 712B
- 36 Tournament Tee Dr
- 24 Tournament Tee Dr
- 2618 Samuel Dr
- 29 Tournament Tee Dr
- 31 Tournament Tee Dr
- 2628 Samuel Dr
- 22 Tournament Tee Dr
- 27 Tournament Tee Dr
- 33 Tournament Tee Dr