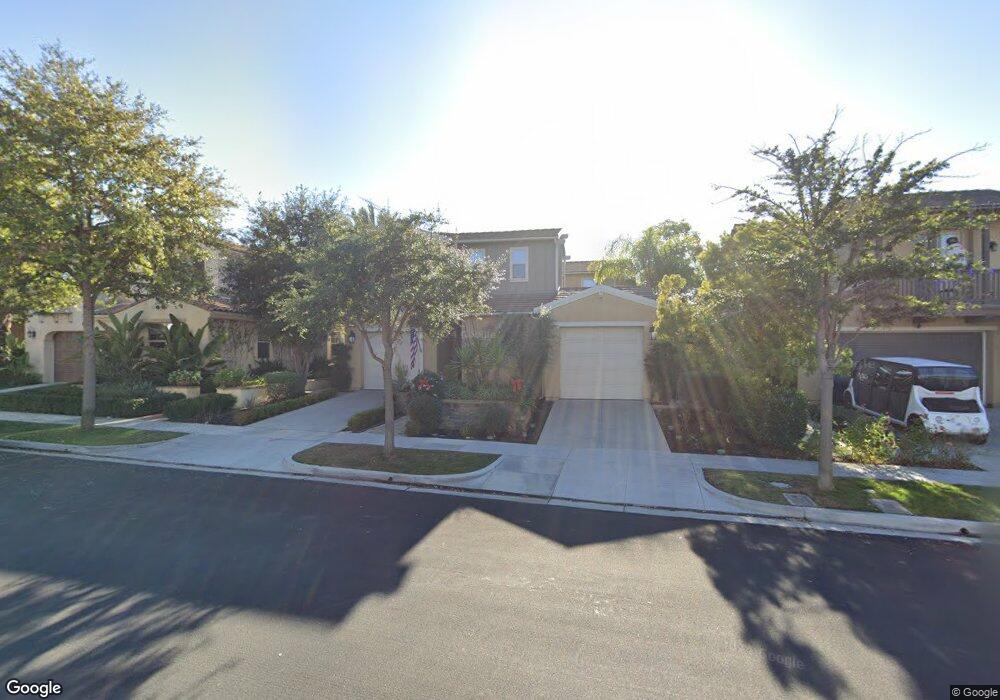
30 Vivido St Ladera Ranch, CA 92694
Estimated Value: $1,846,939 - $2,100,000
3
Beds
4
Baths
2,707
Sq Ft
$727/Sq Ft
Est. Value
About This Home
This home is located at 30 Vivido St, Ladera Ranch, CA 92694 and is currently estimated at $1,968,735, approximately $727 per square foot. 30 Vivido St is a home with nearby schools including Esencia, Tesoro High School, and Montessori of Ladera Ranch School.
Ownership History
Date
Name
Owned For
Owner Type
Purchase Details
Closed on
Mar 4, 2015
Sold by
Meritage Homes Of California Inc
Bought by
Spory Ralph Merle and Todd Nina T
Current Estimated Value
Home Financials for this Owner
Home Financials are based on the most recent Mortgage that was taken out on this home.
Original Mortgage
$563,835
Outstanding Balance
$431,362
Interest Rate
3.65%
Mortgage Type
VA
Estimated Equity
$1,537,373
Create a Home Valuation Report for This Property
The Home Valuation Report is an in-depth analysis detailing your home's value as well as a comparison with similar homes in the area
Home Values in the Area
Average Home Value in this Area
Purchase History
| Date | Buyer | Sale Price | Title Company |
|---|---|---|---|
| Spory Ralph Merle | $1,050,000 | First American Title Company |
Source: Public Records
Mortgage History
| Date | Status | Borrower | Loan Amount |
|---|---|---|---|
| Open | Spory Ralph Merle | $563,835 |
Source: Public Records
Tax History Compared to Growth
Tax History
| Year | Tax Paid | Tax Assessment Tax Assessment Total Assessment is a certain percentage of the fair market value that is determined by local assessors to be the total taxable value of land and additions on the property. | Land | Improvement |
|---|---|---|---|---|
| 2025 | $16,395 | $1,261,926 | $652,383 | $609,543 |
| 2024 | $16,395 | $1,237,183 | $639,591 | $597,592 |
| 2023 | $16,029 | $1,212,925 | $627,050 | $585,875 |
| 2022 | $16,895 | $1,162,800 | $605,472 | $557,328 |
| 2021 | $16,634 | $1,140,000 | $593,600 | $546,400 |
| 2020 | $15,561 | $1,040,400 | $493,976 | $546,424 |
| 2019 | $15,469 | $1,020,000 | $484,290 | $535,710 |
| 2018 | $15,543 | $1,020,000 | $484,290 | $535,710 |
| 2017 | $16,632 | $1,087,322 | $562,116 | $525,206 |
| 2016 | $16,774 | $1,066,002 | $551,094 | $514,908 |
| 2015 | $13,148 | $770,542 | $280,547 | $489,995 |
| 2014 | $13,142 | $755,449 | $275,052 | $480,397 |
Source: Public Records
Map
Nearby Homes