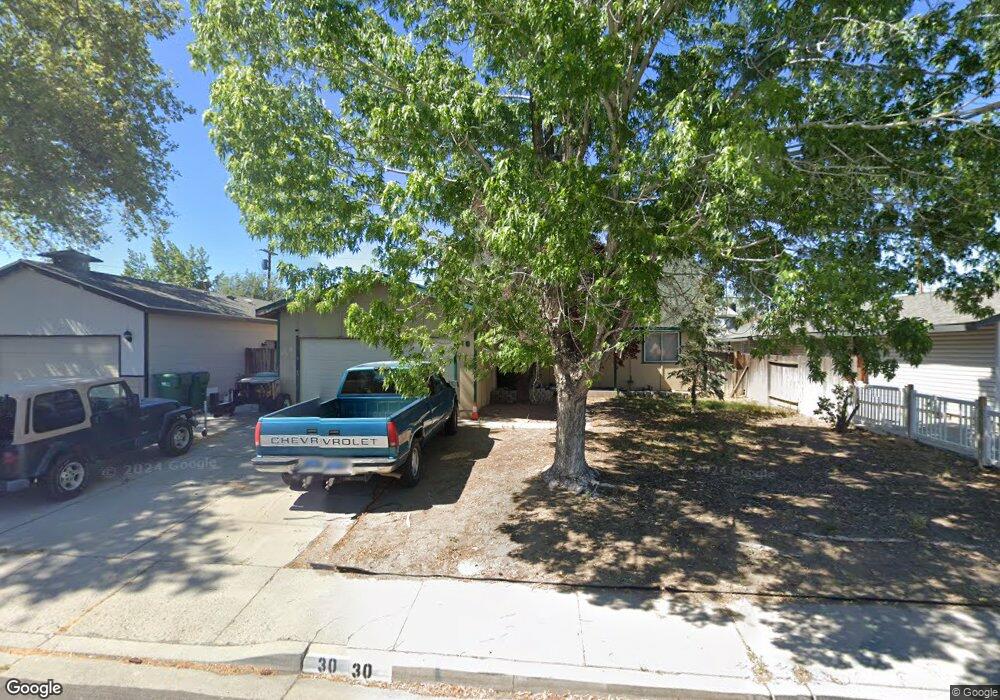
30 York Way Sparks, NV 89431
McCarran Boulevard-Probasco NeighborhoodEstimated Value: $409,654 - $440,000
4
Beds
2
Baths
1,406
Sq Ft
$305/Sq Ft
Est. Value
About This Home
This home is located at 30 York Way, Sparks, NV 89431 and is currently estimated at $428,164, approximately $304 per square foot. 30 York Way is a home located in Washoe County with nearby schools including Florence Drake Elementary School, George L Dilworth Middle School, and Sparks High School.
Ownership History
Date
Name
Owned For
Owner Type
Purchase Details
Closed on
May 25, 2022
Sold by
Henderson Joseph M
Bought by
Henderson Joseph M and Henderson Dawn M
Current Estimated Value
Home Financials for this Owner
Home Financials are based on the most recent Mortgage that was taken out on this home.
Original Mortgage
$100,000
Outstanding Balance
$94,998
Interest Rate
5.25%
Mortgage Type
Credit Line Revolving
Estimated Equity
$333,166
Purchase Details
Closed on
Oct 18, 2006
Sold by
Henderson Dawn M
Bought by
Henderson Joseph M
Purchase Details
Closed on
Sep 12, 1996
Sold by
Henderson Vickie J
Bought by
Henderson Dean
Home Financials for this Owner
Home Financials are based on the most recent Mortgage that was taken out on this home.
Original Mortgage
$121,524
Interest Rate
8.23%
Mortgage Type
FHA
Purchase Details
Closed on
Aug 29, 1996
Sold by
Vanderziel Christopher and Vanderziel Charlotte
Bought by
Henderson Joseph M and Henderson Dean
Home Financials for this Owner
Home Financials are based on the most recent Mortgage that was taken out on this home.
Original Mortgage
$121,524
Interest Rate
8.23%
Mortgage Type
FHA
Create a Home Valuation Report for This Property
The Home Valuation Report is an in-depth analysis detailing your home's value as well as a comparison with similar homes in the area
Home Values in the Area
Average Home Value in this Area
Purchase History
| Date | Buyer | Sale Price | Title Company |
|---|---|---|---|
| Henderson Joseph M | -- | Radian Settlement Services | |
| Henderson Joseph M | -- | None Available | |
| Henderson Joseph M | -- | None Available | |
| Henderson Dean | -- | Founders Title Co | |
| Henderson Joseph M | $122,500 | Founders Title Co |
Source: Public Records
Mortgage History
| Date | Status | Borrower | Loan Amount |
|---|---|---|---|
| Open | Henderson Joseph M | $100,000 | |
| Previous Owner | Henderson Dean | $121,524 |
Source: Public Records
Tax History Compared to Growth
Tax History
| Year | Tax Paid | Tax Assessment Tax Assessment Total Assessment is a certain percentage of the fair market value that is determined by local assessors to be the total taxable value of land and additions on the property. | Land | Improvement |
|---|---|---|---|---|
| 2025 | $757 | $52,206 | $33,565 | $18,641 |
| 2024 | $735 | $48,416 | $30,065 | $18,351 |
| 2023 | $735 | $48,308 | $31,325 | $16,983 |
| 2022 | $714 | $40,050 | $26,180 | $13,870 |
| 2021 | $694 | $31,456 | $17,955 | $13,501 |
| 2020 | $672 | $30,187 | $16,940 | $13,247 |
| 2019 | $653 | $28,410 | $15,890 | $12,520 |
| 2018 | $634 | $23,725 | $11,725 | $12,000 |
| 2017 | $616 | $22,178 | $10,395 | $11,783 |
| 2016 | $601 | $21,149 | $9,345 | $11,804 |
| 2015 | $599 | $19,276 | $7,700 | $11,576 |
| 2014 | $582 | $17,349 | $6,440 | $10,909 |
| 2013 | -- | $15,511 | $4,270 | $11,241 |
Source: Public Records
Map
Nearby Homes
- 10 Sheridan Way
- 119 Devere Way
- 1940 4th St Unit 20
- 1940 4th St Unit 51
- 120 E Lenwood Dr
- 2865 Patrice Dr
- 1703 1st St
- 8 E O St
- 1945 4th St Unit 32
- 1945 4th St Unit 33
- 1945 4th St Unit 10
- 465 Lenwood Dr
- 3071 Meadowlands Dr
- 3245 Elaine Way
- 3104 Sandy St
- 780 Emerson Way
- 707 Glen Meadow Dr
- 745 Glen Vista Dr
- 370 O'Brien Way
- 300 I St
- 50 York Way
- 2415 Courtland Way
- 70 York Way
- 35 Mcgoldrick Way
- 15 Mcgoldrick Way
- 55 Mcgoldrick Way
- 75 Mcgoldrick Way
- 80 York Way
- 13 York Way
- 63 York Way
- 2420 Courtland Way
- 2450 Courtland Way
- 85 Mcgoldrick Way
- 2480 Courtland Way
- 92 York Way
- 73 York Way
- 23 York Way
- 95 Mcgoldrick Way
- 53 York Way
- 2500 Courtland Way