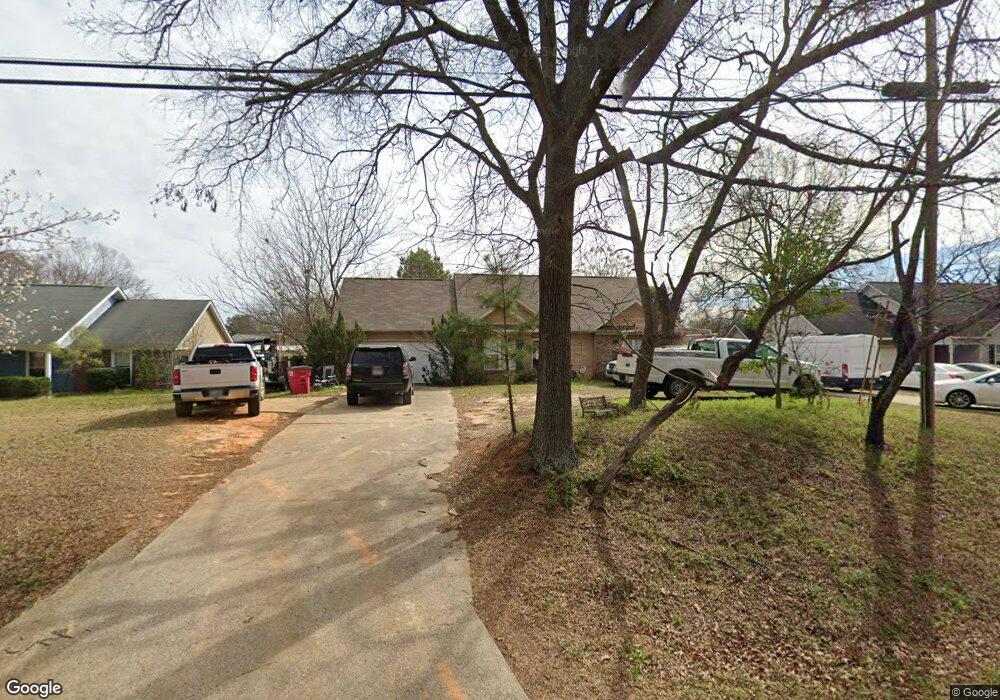
300 Collins Ave Centerville, GA 31028
Estimated Value: $190,000 - $220,000
3
Beds
2
Baths
1,154
Sq Ft
$173/Sq Ft
Est. Value
About This Home
This home is located at 300 Collins Ave, Centerville, GA 31028 and is currently estimated at $199,509, approximately $172 per square foot. 300 Collins Ave is a home located in Houston County with nearby schools including Centerville Elementary School, Thomson Middle School, and Northside High School.
Ownership History
Date
Name
Owned For
Owner Type
Purchase Details
Closed on
Sep 30, 2008
Sold by
Hammock Harvey L
Bought by
Hammock Harvey L and Hammock Jennifer L
Current Estimated Value
Home Financials for this Owner
Home Financials are based on the most recent Mortgage that was taken out on this home.
Original Mortgage
$108,834
Outstanding Balance
$72,442
Interest Rate
6.45%
Mortgage Type
FHA
Estimated Equity
$127,067
Purchase Details
Closed on
Jan 17, 2007
Sold by
Woodcock Elwood Lee and Woodcock Judy C
Bought by
Pettis Anna K
Home Financials for this Owner
Home Financials are based on the most recent Mortgage that was taken out on this home.
Original Mortgage
$83,000
Interest Rate
6.05%
Mortgage Type
Purchase Money Mortgage
Purchase Details
Closed on
Dec 5, 1996
Sold by
Franks Properties Inc
Bought by
Woodcock Elwood L and Woodcock Judy C
Purchase Details
Closed on
Mar 26, 1996
Sold by
Southfork Investment Company Llc
Bought by
Franks Properties Inc
Create a Home Valuation Report for This Property
The Home Valuation Report is an in-depth analysis detailing your home's value as well as a comparison with similar homes in the area
Home Values in the Area
Average Home Value in this Area
Purchase History
| Date | Buyer | Sale Price | Title Company |
|---|---|---|---|
| Hammock Harvey L | -- | None Available | |
| Hammock Harvey L | $110,000 | None Available | |
| Pettis Anna K | $71,000 | None Available | |
| Woodcock Elwood L | $72,500 | -- | |
| Franks Properties Inc | -- | -- |
Source: Public Records
Mortgage History
| Date | Status | Borrower | Loan Amount |
|---|---|---|---|
| Open | Hammock Harvey L | $108,834 | |
| Previous Owner | Pettis Anna K | $83,000 |
Source: Public Records
Tax History
| Year | Tax Paid | Tax Assessment Tax Assessment Total Assessment is a certain percentage of the fair market value that is determined by local assessors to be the total taxable value of land and additions on the property. | Land | Improvement |
|---|---|---|---|---|
| 2024 | $1,710 | $50,600 | $6,400 | $44,200 |
| 2023 | $1,504 | $44,360 | $6,400 | $37,960 |
| 2022 | $896 | $40,960 | $4,800 | $36,160 |
| 2021 | $730 | $33,560 | $4,320 | $29,240 |
| 2020 | $721 | $33,040 | $4,320 | $28,720 |
| 2019 | $721 | $33,040 | $4,320 | $28,720 |
| 2018 | $721 | $33,040 | $4,320 | $28,720 |
| 2017 | $722 | $33,040 | $4,320 | $28,720 |
| 2016 | $723 | $33,040 | $4,320 | $28,720 |
| 2015 | $724 | $33,040 | $4,320 | $28,720 |
| 2014 | -- | $33,040 | $4,320 | $28,720 |
| 2013 | -- | $35,440 | $5,400 | $30,040 |
Source: Public Records
Map
Nearby Homes
- 214 Mcvey Trail
- 208 Bassett St
- 202 Bassett St
- 114 Collins Estate Ave
- 200 Collins Estate Ave
- 107 Miller Ct
- 102 Lee St Unit 117 Wilson Drive
- 102 Lee St
- 105 Parker Ln
- 110 Lee St
- 132 Montrose Ln
- 111 Montrose Ln
- 115 Montrose Ln
- 109 Creek Bluff Trail
- 117 Crestwood Ct
- 100 Jamestown Ct
- 121 Crestwood Rd
- 106 Bretwood Ct
- 103 Westoak Ct
- 108 Madison Ave
- 290 Collins Ave
- 302 Collins Ave
- 108 Ridge Ct
- 288 Collins Ave
- 106 Ridge Ct
- 304 Collins Ave
- 305 Collins Ave
- 110 Ridge Ct
- 104 Ridge Ct
- 303 Collins Ave
- 301 Collins Ave
- 286 Collins Ave
- 102 Ridge Ct
- 307 Collins Ave
- 112 Ridge Ct
- 100 Ashlund Dr
- 309 Collins Ave
- 115 Jeanette Place
- 113 Jeanette Place
- 284 Collins Ave
Your Personal Tour Guide
Ask me questions while you tour the home.