
Seller's Agent in 2024
Randy Sumbles
The Sumbles Team Keller Williams Realty
(501) 960-4111
14 in this area
454 Total Sales
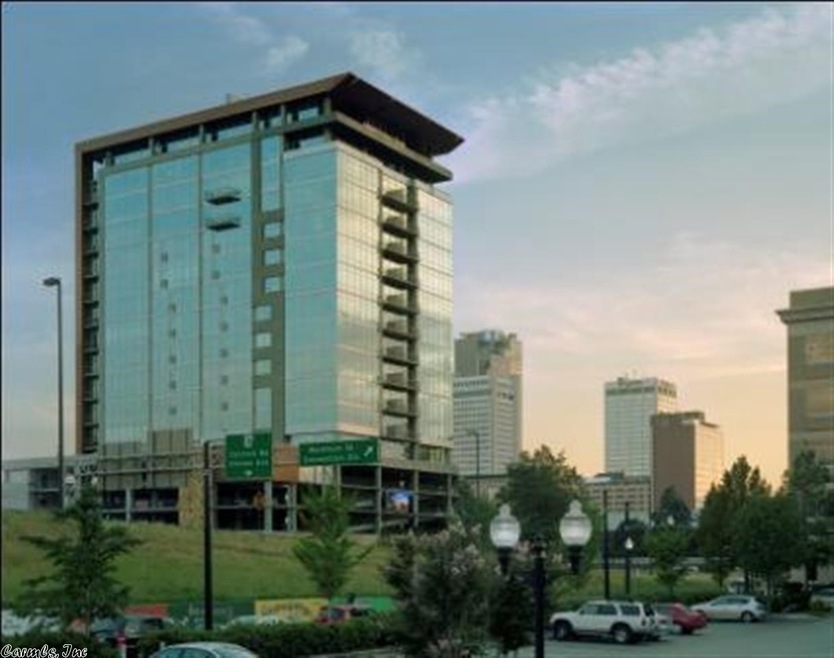
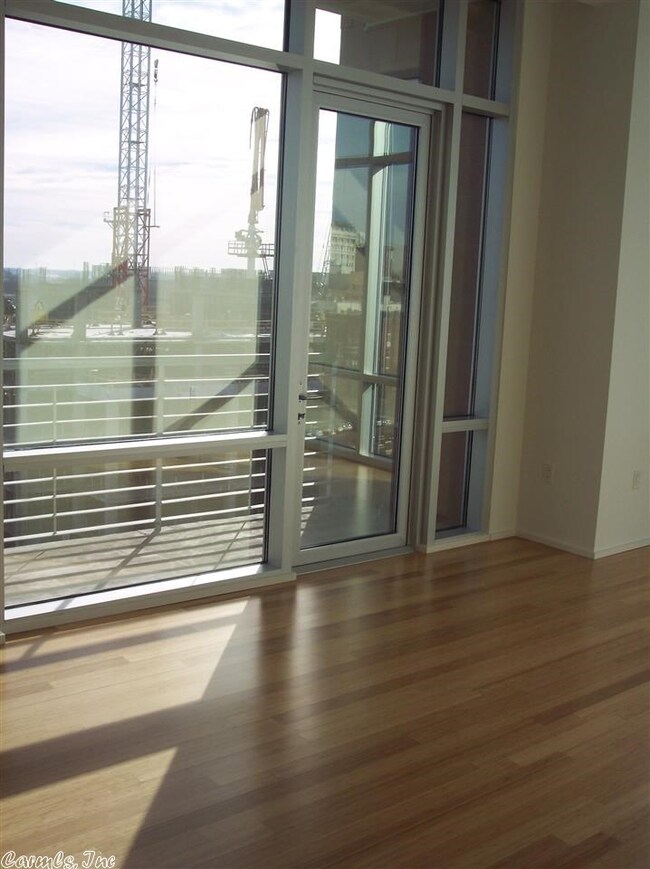
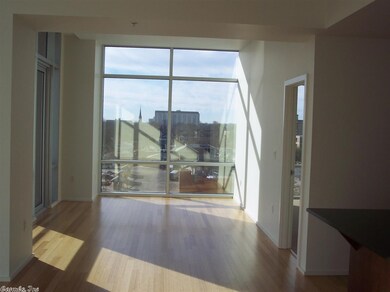
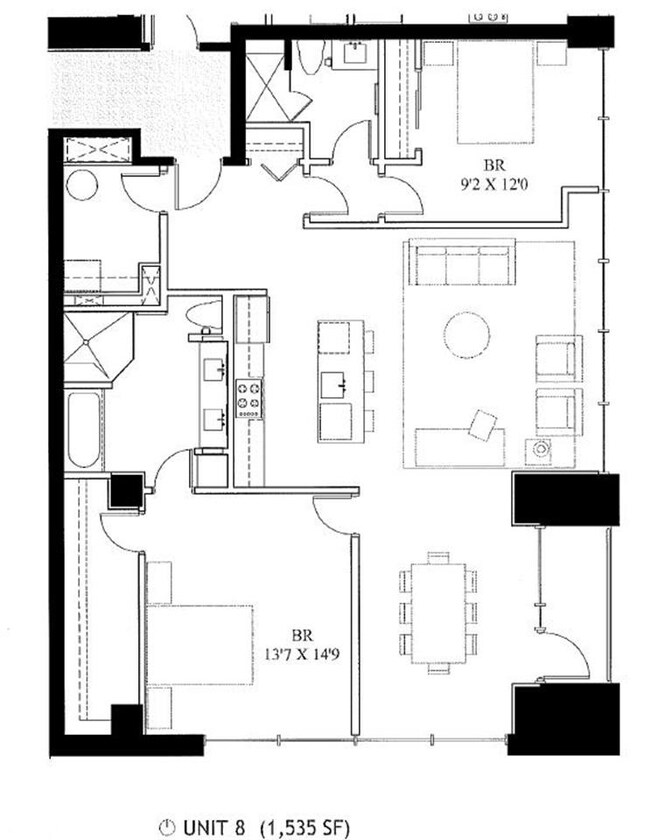
Two bedroom split floor plan with private terrace. Bamboo floors, large master bath, walk in closets, floor to ceiling windows, 2 reserved parking spaces convey. No other unit on the market with this layout!
| Date | Type | Sale Price | Title Company |
|---|---|---|---|
| Warranty Deed | -- | Bishop Matt |
| Date | Event | Price | Change | Sq Ft Price |
|---|---|---|---|---|
| 09/30/2024 09/30/24 | Sold | $1,000,000 | -9.1% | $375 / Sq Ft |
| 06/13/2024 06/13/24 | Price Changed | $1,099,900 | +318.4% | $412 / Sq Ft |
| 06/11/2024 06/11/24 | Sold | $262,900 | -2.6% | $202 / Sq Ft |
| 05/17/2024 05/17/24 | Pending | -- | -- | -- |
| 05/07/2024 05/07/24 | Price Changed | $269,900 | -30.3% | $208 / Sq Ft |
| 04/29/2024 04/29/24 | Sold | $387,500 | +41.0% | $262 / Sq Ft |
| 04/11/2024 04/11/24 | Pending | -- | -- | -- |
| 04/09/2024 04/09/24 | For Sale | $274,900 | -31.3% | $212 / Sq Ft |
| 12/31/2023 12/31/23 | For Sale | $400,000 | -65.2% | $270 / Sq Ft |
| 12/30/2023 12/30/23 | Price Changed | $1,150,000 | 0.0% | $431 / Sq Ft |
| 09/23/2023 09/23/23 | Rented | $2,500 | 0.0% | -- |
| 06/03/2023 06/03/23 | For Sale | $1,300,000 | +109.3% | $487 / Sq Ft |
| 06/02/2023 06/02/23 | Sold | $621,000 | 0.0% | $319 / Sq Ft |
| 04/21/2023 04/21/23 | For Rent | $2,500 | 0.0% | -- |
| 02/24/2023 02/24/23 | For Sale | $695,000 | +215.9% | $357 / Sq Ft |
| 12/12/2022 12/12/22 | Sold | $220,000 | +4.3% | $229 / Sq Ft |
| 11/12/2022 11/12/22 | Pending | -- | -- | -- |
| 08/26/2022 08/26/22 | Sold | $211,000 | -8.3% | $265 / Sq Ft |
| 08/25/2022 08/25/22 | For Sale | $230,000 | +7.0% | $240 / Sq Ft |
| 08/22/2022 08/22/22 | Pending | -- | -- | -- |
| 08/11/2022 08/11/22 | For Sale | $215,000 | -58.3% | $270 / Sq Ft |
| 06/17/2022 06/17/22 | Sold | $515,000 | +106.0% | $232 / Sq Ft |
| 06/15/2022 06/15/22 | Sold | $250,000 | -0.8% | $261 / Sq Ft |
| 06/15/2022 06/15/22 | Pending | -- | -- | -- |
| 06/15/2022 06/15/22 | Pending | -- | -- | -- |
| 05/01/2022 05/01/22 | For Sale | $252,000 | -54.2% | $263 / Sq Ft |
| 04/05/2022 04/05/22 | Price Changed | $549,900 | -6.8% | $247 / Sq Ft |
| 01/07/2022 01/07/22 | For Sale | $589,900 | 0.0% | $265 / Sq Ft |
| 11/30/2021 11/30/21 | Rented | $1,800 | 0.0% | -- |
| 08/08/2021 08/08/21 | For Rent | $1,800 | 0.0% | -- |
| 08/06/2021 08/06/21 | Sold | $275,000 | 0.0% | $212 / Sq Ft |
| 06/17/2021 06/17/21 | Sold | $275,000 | -4.8% | $212 / Sq Ft |
| 05/24/2021 05/24/21 | Pending | -- | -- | -- |
| 05/20/2021 05/20/21 | For Sale | $289,000 | 0.0% | $222 / Sq Ft |
| 05/11/2021 05/11/21 | Price Changed | $289,000 | -1.4% | $222 / Sq Ft |
| 03/01/2021 03/01/21 | Price Changed | $293,000 | -0.7% | $226 / Sq Ft |
| 01/19/2021 01/19/21 | For Sale | $295,000 | 0.0% | $227 / Sq Ft |
| 08/28/2020 08/28/20 | Rented | $1,600 | 0.0% | -- |
| 08/05/2020 08/05/20 | Pending | -- | -- | -- |
| 07/31/2020 07/31/20 | Sold | $205,000 | -6.4% | $214 / Sq Ft |
| 06/22/2020 06/22/20 | For Sale | $219,000 | 0.0% | $228 / Sq Ft |
| 06/05/2020 06/05/20 | For Rent | $1,600 | 0.0% | -- |
| 01/07/2020 01/07/20 | Pending | -- | -- | -- |
| 01/01/2020 01/01/20 | Off Market | $285,000 | -- | -- |
| 12/30/2019 12/30/19 | Sold | $285,000 | -7.8% | $215 / Sq Ft |
| 12/03/2019 12/03/19 | For Sale | $309,000 | +8.4% | $233 / Sq Ft |
| 12/03/2019 12/03/19 | Off Market | $285,000 | -- | -- |
| 10/18/2019 10/18/19 | Sold | $220,000 | -28.8% | $265 / Sq Ft |
| 08/22/2019 08/22/19 | Price Changed | $309,000 | +34.9% | $233 / Sq Ft |
| 08/21/2019 08/21/19 | For Sale | $229,000 | +6.5% | $276 / Sq Ft |
| 08/10/2019 08/10/19 | Off Market | $215,000 | -- | -- |
| 08/09/2019 08/09/19 | Sold | $215,000 | -2.2% | $239 / Sq Ft |
| 06/25/2019 06/25/19 | Price Changed | $219,900 | -2.0% | $245 / Sq Ft |
| 06/07/2019 06/07/19 | Price Changed | $224,500 | -29.6% | $250 / Sq Ft |
| 06/03/2019 06/03/19 | For Sale | $319,000 | +11.9% | $240 / Sq Ft |
| 06/02/2019 06/02/19 | Off Market | $285,000 | -- | -- |
| 05/10/2019 05/10/19 | For Sale | $224,900 | -29.5% | $250 / Sq Ft |
| 05/07/2019 05/07/19 | Price Changed | $319,000 | -25.8% | $240 / Sq Ft |
| 03/15/2019 03/15/19 | Sold | $430,000 | 0.0% | $280 / Sq Ft |
| 01/24/2019 01/24/19 | Pending | -- | -- | -- |
| 01/23/2019 01/23/19 | Off Market | $430,000 | -- | -- |
| 01/03/2019 01/03/19 | For Sale | $330,000 | -28.2% | $249 / Sq Ft |
| 10/23/2018 10/23/18 | For Sale | $459,900 | -26.4% | $300 / Sq Ft |
| 06/26/2018 06/26/18 | Sold | $625,000 | +31150.0% | $313 / Sq Ft |
| 06/17/2018 06/17/18 | Pending | -- | -- | -- |
| 06/08/2018 06/08/18 | Rented | $2,000 | 0.0% | -- |
| 04/09/2018 04/09/18 | Price Changed | $2,000 | -9.1% | $2 / Sq Ft |
| 03/15/2018 03/15/18 | For Rent | $2,200 | 0.0% | -- |
| 01/31/2018 01/31/18 | Sold | $192,000 | -10.7% | $184 / Sq Ft |
| 01/23/2018 01/23/18 | Pending | -- | -- | -- |
| 12/27/2017 12/27/17 | Price Changed | $215,000 | -2.2% | $206 / Sq Ft |
| 12/22/2017 12/22/17 | For Sale | $219,900 | 0.0% | $210 / Sq Ft |
| 12/07/2017 12/07/17 | Pending | -- | -- | -- |
| 10/31/2017 10/31/17 | Price Changed | $219,900 | -4.3% | $210 / Sq Ft |
| 10/03/2017 10/03/17 | Price Changed | $229,900 | -4.2% | $220 / Sq Ft |
| 09/05/2017 09/05/17 | Price Changed | $239,900 | -4.0% | $230 / Sq Ft |
| 06/27/2017 06/27/17 | For Sale | $249,900 | -6.4% | $239 / Sq Ft |
| 10/17/2016 10/17/16 | Sold | $267,000 | -0.9% | $206 / Sq Ft |
| 09/26/2016 09/26/16 | For Sale | $269,500 | -16.4% | $207 / Sq Ft |
| 09/25/2015 09/25/15 | Sold | $322,500 | -7.8% | $248 / Sq Ft |
| 08/26/2015 08/26/15 | Pending | -- | -- | -- |
| 08/12/2015 08/12/15 | For Sale | $349,900 | +51.5% | $269 / Sq Ft |
| 07/24/2015 07/24/15 | Sold | $231,000 | +18.5% | $220 / Sq Ft |
| 06/24/2015 06/24/15 | Pending | -- | -- | -- |
| 06/08/2015 06/08/15 | Sold | $195,000 | -29.1% | $235 / Sq Ft |
| 05/09/2015 05/09/15 | Pending | -- | -- | -- |
| 05/04/2015 05/04/15 | For Sale | $274,900 | +25.0% | $262 / Sq Ft |
| 12/23/2014 12/23/14 | For Sale | $220,000 | -33.1% | $265 / Sq Ft |
| 08/26/2014 08/26/14 | Sold | $329,000 | 0.0% | $248 / Sq Ft |
| 07/27/2014 07/27/14 | Pending | -- | -- | -- |
| 06/04/2014 06/04/14 | For Sale | $329,000 | -5.7% | $248 / Sq Ft |
| 12/12/2013 12/12/13 | Sold | $349,000 | -39.8% | $227 / Sq Ft |
| 11/12/2013 11/12/13 | Pending | -- | -- | -- |
| 10/04/2013 10/04/13 | Sold | $580,000 | +32.1% | $279 / Sq Ft |
| 10/01/2013 10/01/13 | For Sale | $439,000 | -32.5% | $286 / Sq Ft |
| 09/04/2013 09/04/13 | Pending | -- | -- | -- |
| 04/29/2013 04/29/13 | For Sale | $650,000 | +31.3% | $313 / Sq Ft |
| 10/29/2012 10/29/12 | Sold | $495,000 | -8.3% | $266 / Sq Ft |
| 09/29/2012 09/29/12 | Pending | -- | -- | -- |
| 03/29/2012 03/29/12 | For Sale | $539,900 | -- | $290 / Sq Ft |
| Year | Tax Paid | Tax Assessment Tax Assessment Total Assessment is a certain percentage of the fair market value that is determined by local assessors to be the total taxable value of land and additions on the property. | Land | Improvement |
|---|---|---|---|---|
| 2024 | $825,606 | $14,118,418 | $395,290 | $13,723,128 |
| 2023 | $825,606 | $14,118,418 | $395,290 | $13,723,128 |
| 2022 | $756,806 | $14,118,418 | $395,290 | $13,723,128 |
| 2021 | $688,006 | $9,828,650 | $0 | $9,828,650 |
| 2020 | $688,006 | $9,828,650 | $0 | $9,828,650 |
| 2019 | $688,006 | $9,828,650 | $0 | $9,828,650 |
| 2018 | $688,006 | $9,828,650 | $0 | $9,828,650 |
| 2017 | $688,006 | $9,828,650 | $0 | $9,828,650 |
Seller's Agent in 2024
Randy Sumbles
The Sumbles Team Keller Williams Realty
(501) 960-4111
14 in this area
454 Total Sales
Seller's Agent in 2024
Ana Bridges
AB Realty
(501) 944-5460
1 in this area
50 Total Sales
Seller's Agent in 2024
Toni Knowles
Crye-Leike
(501) 350-5800
4 in this area
291 Total Sales
Buyer's Agent in 2024
Aleisha McIntire
IRealty Arkansas - Benton
(501) 240-7953
2 in this area
154 Total Sales
Buyer's Agent in 2024
Holly Driver
Signature Properties
(501) 912-5231
9 in this area
211 Total Sales
Seller's Agent in 2023
Conley Golden
Janet Jones Company
(501) 786-4550
5 in this area
258 Total Sales
Source: Cooperative Arkansas REALTORS® MLS
MLS Number: 10365573
APN: 34L-020-40-000-00
Disclaimer: Certain information contained herein is derived from information provided by parties other than Homes.com. All information provided is deemed reliable, but is not guaranteed to be accurate and should be independently verified.
![]() IDX information is provided exclusively for personal, non-commercial use, and may not be used for any purpose other than to identify prospective properties consumers may be interested in purchasing.
IDX information is provided exclusively for personal, non-commercial use, and may not be used for any purpose other than to identify prospective properties consumers may be interested in purchasing.