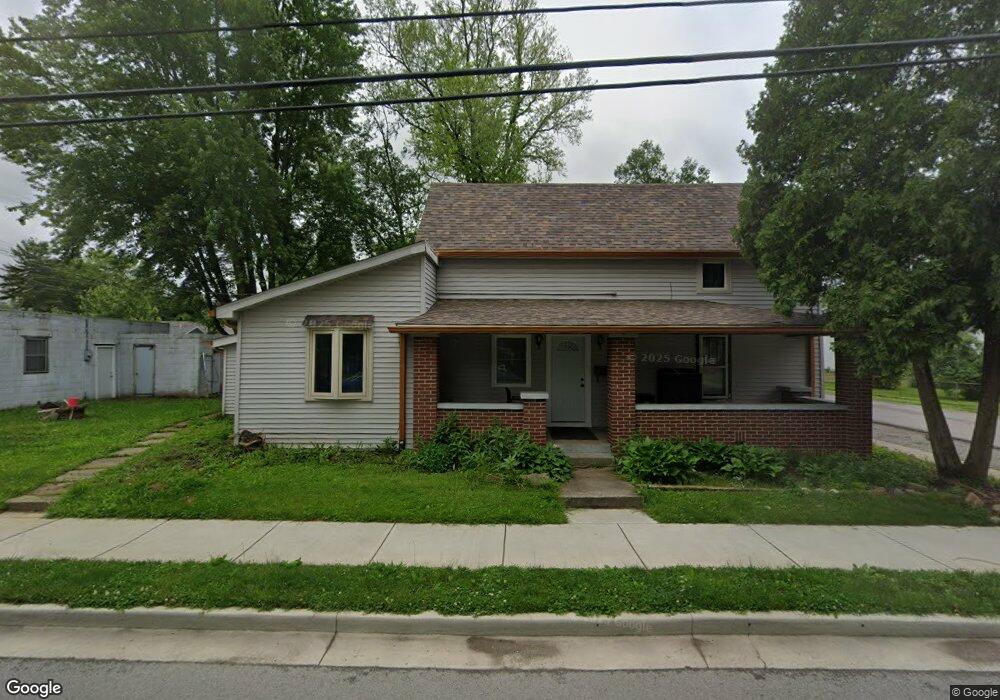
300 E Water St Pendleton, IN 46064
Estimated Value: $170,000 - $283,000
3
Beds
1
Bath
1,296
Sq Ft
$178/Sq Ft
Est. Value
About This Home
This home is located at 300 E Water St, Pendleton, IN 46064 and is currently estimated at $230,404, approximately $177 per square foot. 300 E Water St is a home located in Madison County with nearby schools including Pendleton Elementary School and Pendleton Heights Middle School.
Ownership History
Date
Name
Owned For
Owner Type
Purchase Details
Closed on
Sep 19, 2024
Sold by
Reynolds Christopher K
Bought by
Capua William Joseph
Current Estimated Value
Home Financials for this Owner
Home Financials are based on the most recent Mortgage that was taken out on this home.
Original Mortgage
$142,500
Outstanding Balance
$140,621
Interest Rate
6.47%
Mortgage Type
New Conventional
Estimated Equity
$89,783
Purchase Details
Closed on
Dec 23, 2020
Sold by
Reynolds Angela L and Reynolds Purvis L
Bought by
Reynolds Christopher K
Purchase Details
Closed on
Feb 28, 2006
Sold by
Bryant Paula S
Bought by
Reynols Angela L and Reynols Purvis L
Home Financials for this Owner
Home Financials are based on the most recent Mortgage that was taken out on this home.
Original Mortgage
$97,132
Interest Rate
6.33%
Mortgage Type
FHA
Create a Home Valuation Report for This Property
The Home Valuation Report is an in-depth analysis detailing your home's value as well as a comparison with similar homes in the area
Home Values in the Area
Average Home Value in this Area
Purchase History
| Date | Buyer | Sale Price | Title Company |
|---|---|---|---|
| Capua William Joseph | $150,000 | None Listed On Document | |
| Reynolds Christopher K | -- | None Available | |
| Reynols Angela L | -- | -- |
Source: Public Records
Mortgage History
| Date | Status | Borrower | Loan Amount |
|---|---|---|---|
| Open | Capua William Joseph | $142,500 | |
| Previous Owner | Reynols Angela L | $97,132 |
Source: Public Records
Tax History
| Year | Tax Paid | Tax Assessment Tax Assessment Total Assessment is a certain percentage of the fair market value that is determined by local assessors to be the total taxable value of land and additions on the property. | Land | Improvement |
|---|---|---|---|---|
| 2025 | $987 | $125,900 | $18,900 | $107,000 |
| 2024 | $987 | $117,900 | $18,900 | $99,000 |
| 2023 | $1,019 | $108,200 | $18,000 | $90,200 |
| 2022 | $909 | $99,800 | $17,200 | $82,600 |
| 2021 | $808 | $92,500 | $17,200 | $75,300 |
| 2020 | $783 | $88,300 | $16,400 | $71,900 |
| 2019 | $638 | $86,100 | $16,400 | $69,700 |
| 2018 | $558 | $80,200 | $16,300 | $63,900 |
| 2017 | $491 | $73,800 | $15,100 | $58,700 |
| 2016 | $490 | $73,800 | $15,100 | $58,700 |
| 2014 | $485 | $72,600 | $15,100 | $57,500 |
| 2013 | $485 | $72,600 | $15,100 | $57,500 |
Source: Public Records
Map
Nearby Homes
- 201 N East St
- 400 E Water St
- 1000 East St
- 110 W Water St
- 315 W High St
- 460 E Madison Ave
- 513 W State St
- 227 Jefferson St
- 6972 S 300 W
- 621 S Silver St
- 238 Jefferson St
- 3006 Huntsville Rd
- 720 S Broadway St
- 291 Limerick Ln
- 0 W State St
- 928 S Broadway St
- 9806 Olympic Blvd
- 8093 Ridge Line Dr
- 637 Kilmore Dr
- 8094 Ridge Line Dr
Your Personal Tour Guide
Ask me questions while you tour the home.