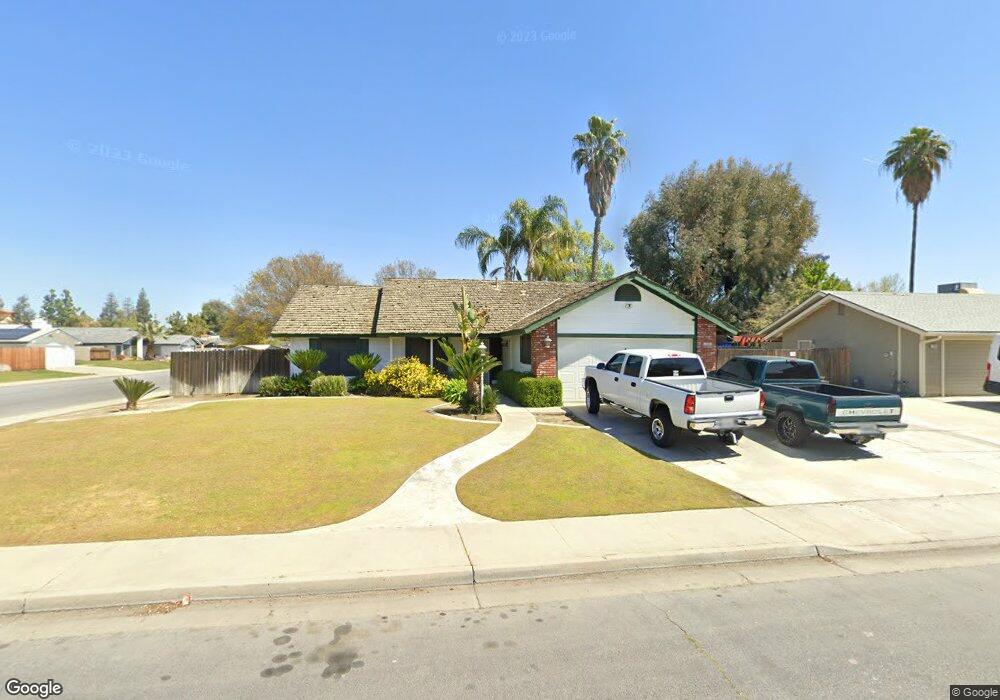
300 Joelyle St Bakersfield, CA 93314
Estimated Value: $363,000 - $394,000
3
Beds
2
Baths
1,420
Sq Ft
$268/Sq Ft
Est. Value
About This Home
This home is located at 300 Joelyle St, Bakersfield, CA 93314 and is currently estimated at $380,077, approximately $267 per square foot. 300 Joelyle St is a home located in Kern County with nearby schools including Del Rio Elementary School, Rosedale Middle School, and Liberty High School.
Ownership History
Date
Name
Owned For
Owner Type
Purchase Details
Closed on
Sep 20, 2001
Sold by
Chance Renee E
Bought by
Chance James E
Current Estimated Value
Home Financials for this Owner
Home Financials are based on the most recent Mortgage that was taken out on this home.
Original Mortgage
$104,200
Outstanding Balance
$40,395
Interest Rate
6.91%
Estimated Equity
$339,682
Purchase Details
Closed on
Jul 18, 1996
Sold by
Chance James E
Bought by
Chance James E and Chance Renee E
Home Financials for this Owner
Home Financials are based on the most recent Mortgage that was taken out on this home.
Original Mortgage
$15,755
Interest Rate
8.3%
Purchase Details
Closed on
Mar 24, 1994
Sold by
Boles Michael D and Boles Gina L
Bought by
Chance James E
Home Financials for this Owner
Home Financials are based on the most recent Mortgage that was taken out on this home.
Original Mortgage
$97,500
Interest Rate
7.67%
Create a Home Valuation Report for This Property
The Home Valuation Report is an in-depth analysis detailing your home's value as well as a comparison with similar homes in the area
Home Values in the Area
Average Home Value in this Area
Purchase History
| Date | Buyer | Sale Price | Title Company |
|---|---|---|---|
| Chance James E | -- | First American Title Co | |
| Chance James E | -- | American Title Ins Co | |
| Chance James E | $112,000 | Heritage Title Company |
Source: Public Records
Mortgage History
| Date | Status | Borrower | Loan Amount |
|---|---|---|---|
| Open | Chance James E | $104,200 | |
| Closed | Chance James E | $15,755 | |
| Closed | Chance James E | $97,500 |
Source: Public Records
Tax History Compared to Growth
Tax History
| Year | Tax Paid | Tax Assessment Tax Assessment Total Assessment is a certain percentage of the fair market value that is determined by local assessors to be the total taxable value of land and additions on the property. | Land | Improvement |
|---|---|---|---|---|
| 2025 | $2,721 | $190,327 | $67,967 | $122,360 |
| 2024 | $2,654 | $186,596 | $66,635 | $119,961 |
| 2023 | $2,654 | $182,938 | $65,329 | $117,609 |
| 2022 | $2,594 | $179,352 | $64,049 | $115,303 |
| 2021 | $2,476 | $175,837 | $62,794 | $113,043 |
| 2020 | $2,423 | $174,035 | $62,151 | $111,884 |
| 2019 | $2,378 | $174,035 | $62,151 | $111,884 |
| 2018 | $2,324 | $167,280 | $59,739 | $107,541 |
| 2017 | $2,286 | $164,001 | $58,568 | $105,433 |
| 2016 | $2,161 | $160,786 | $57,420 | $103,366 |
| 2015 | $2,122 | $158,372 | $56,558 | $101,814 |
| 2014 | $2,072 | $155,271 | $55,451 | $99,820 |
Source: Public Records
Map
Nearby Homes
- 15829 Cole Brook Ct
- 501 Reed St
- 13301 Birkenfeld Ave
- 13408 Frenchglen Ave
- 201 El Paso Rd
- 13506 Morocco Ave
- 13900 San Lazaro Ave
- 12512 Cheswolde Dr
- 306 Portola Ct
- 601 Las Arenas Ct
- 12608 Fallstaff Ln
- 14004 San Lazaro Ave
- 12217 French Park Ln
- 13904 Las Entradas
- 12411 Riverfront Park Dr
- 14008 Las Entradas
- 14016 Las Entradas
- 307 Coachman Way
- 12811 Woodson Bridge Dr
- 304 Joelyle St
- 301 Jerlee St
- 216 Joelyle St
- 305 Jerlee St Unit A
- 308 Joelyle St
- 13201 Lynett Ct
- 13104 Lynett Way
- 309 Jerlee St
- 212 Joelyle St
- 13200 Warrenton Ave
- 312 Joelyle St
- 217 Joelyle St
- 13205 Lynett Ct
- 13100 Lynett Way
- 313 Jerlee St
- 13204 Warrenton Ave
- 213 Joelyle St Unit A
- 208 Joelyle St Unit A
- 13005 Lynett Way
- 400 Joelyle St