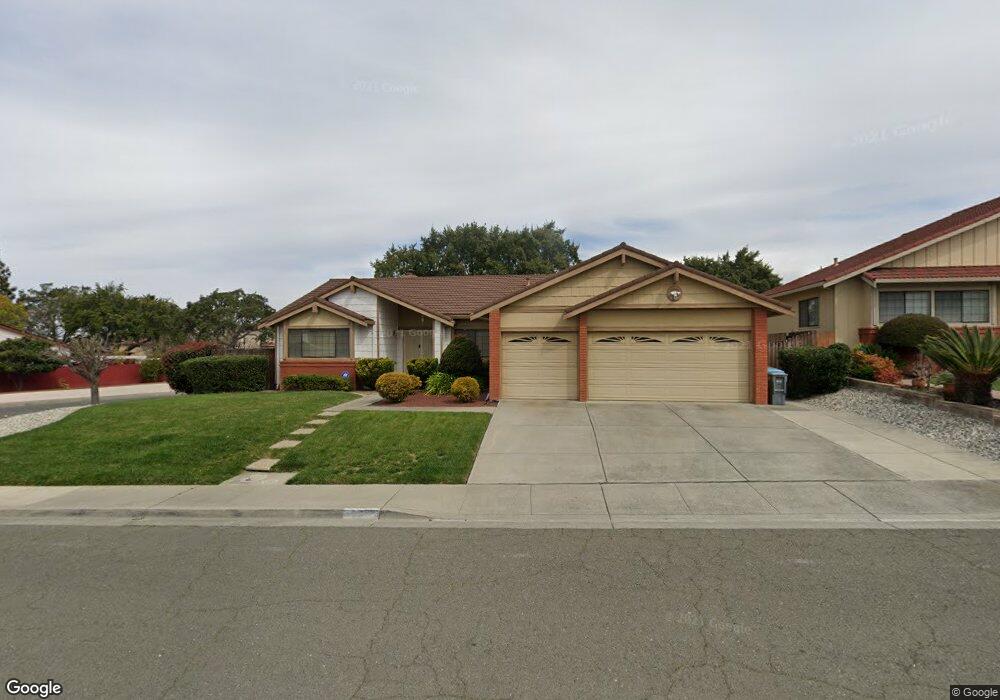
300 Pinto Ct Vallejo, CA 94591
Hunter Ranch NeighborhoodEstimated Value: $640,000 - $743,000
4
Beds
2
Baths
2,077
Sq Ft
$324/Sq Ft
Est. Value
About This Home
This home is located at 300 Pinto Ct, Vallejo, CA 94591 and is currently estimated at $672,279, approximately $323 per square foot. 300 Pinto Ct is a home located in Solano County with nearby schools including Joseph H. Wardlaw Elementary School, Hogan Middle School, and Jesse M. Bethel High School.
Ownership History
Date
Name
Owned For
Owner Type
Purchase Details
Closed on
Dec 28, 2000
Sold by
Smith Gene L
Bought by
Smith Gene L
Current Estimated Value
Purchase Details
Closed on
Mar 10, 1998
Sold by
Poston Arlene R
Bought by
Smith Gene L
Home Financials for this Owner
Home Financials are based on the most recent Mortgage that was taken out on this home.
Original Mortgage
$130,500
Outstanding Balance
$24,063
Interest Rate
7.11%
Estimated Equity
$648,216
Create a Home Valuation Report for This Property
The Home Valuation Report is an in-depth analysis detailing your home's value as well as a comparison with similar homes in the area
Home Values in the Area
Average Home Value in this Area
Purchase History
| Date | Buyer | Sale Price | Title Company |
|---|---|---|---|
| Smith Gene L | -- | -- | |
| Smith Gene L | $64,000 | North American Title Co | |
| Smith Gene L | -- | North American Title Co |
Source: Public Records
Mortgage History
| Date | Status | Borrower | Loan Amount |
|---|---|---|---|
| Open | Smith Gene L | $130,500 |
Source: Public Records
Tax History
| Year | Tax Paid | Tax Assessment Tax Assessment Total Assessment is a certain percentage of the fair market value that is determined by local assessors to be the total taxable value of land and additions on the property. | Land | Improvement |
|---|---|---|---|---|
| 2025 | $4,742 | $299,086 | $143,406 | $155,680 |
| 2024 | $4,742 | $293,223 | $140,595 | $152,628 |
| 2023 | $4,491 | $287,475 | $137,839 | $149,636 |
| 2022 | $4,392 | $281,839 | $135,137 | $146,702 |
| 2021 | $4,283 | $276,314 | $132,488 | $143,826 |
| 2020 | $4,298 | $273,482 | $131,130 | $142,352 |
| 2019 | $4,170 | $268,120 | $128,559 | $139,561 |
| 2018 | $3,916 | $262,864 | $126,039 | $136,825 |
| 2017 | $3,748 | $257,711 | $123,568 | $134,143 |
| 2016 | $3,166 | $252,659 | $121,146 | $131,513 |
| 2015 | $3,122 | $248,865 | $119,327 | $129,538 |
| 2014 | $3,076 | $243,991 | $116,990 | $127,001 |
Source: Public Records
Map
Nearby Homes
- 373 Clydesdale Dr
- 2163 Garnet Cir
- 367 Darley Dr
- 103 Stageline Ct
- 1146 Waltz Ct
- 6067 Loire Ct
- 9216 Hallmark Place
- 9102 Cambridge Cir
- 2890 Redwood Pkwy Unit 61
- 6206 Pebble Beach Dr
- 151 Kathy Ellen Ct
- 4134 Penny Ln
- 125 Skyline Ct
- 1118 Waltz Ct
- 4288 Melody Ln
- 124 Gregory Ln
- 272 Woodridge Dr
- 164 Kathy Ellen Dr
- 0 Fairgrounds Dr Unit 325101300
- 112 Palomar Ln
Your Personal Tour Guide
Ask me questions while you tour the home.