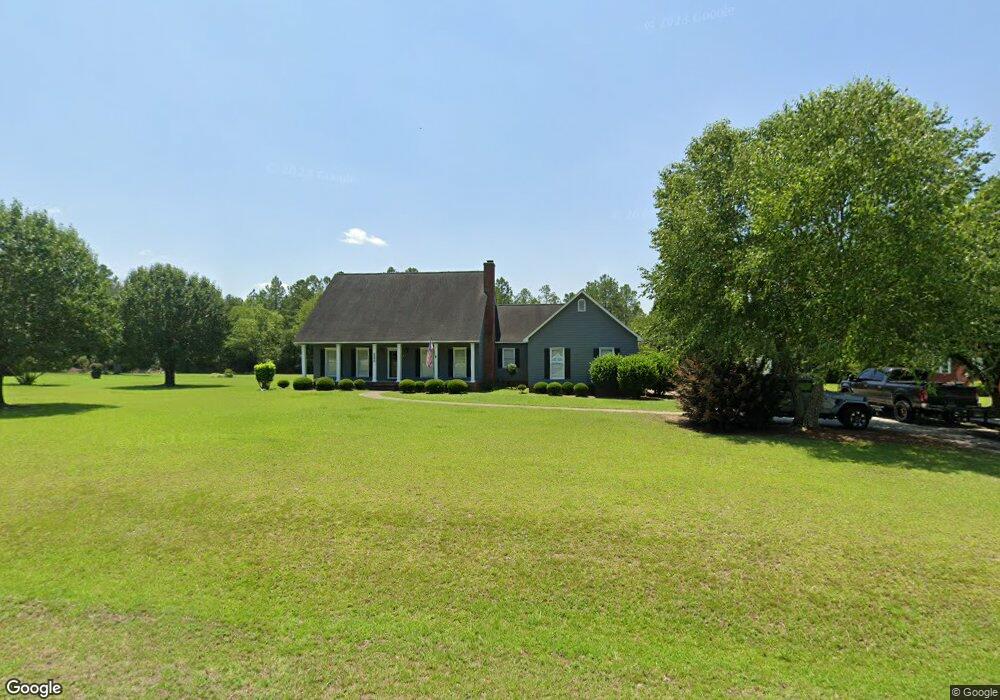
300 Timberland Dr Cordele, GA 31015
Estimated Value: $266,000 - $355,000
3
Beds
3
Baths
2,299
Sq Ft
$135/Sq Ft
Est. Value
About This Home
This home is located at 300 Timberland Dr, Cordele, GA 31015 and is currently estimated at $311,232, approximately $135 per square foot. 300 Timberland Dr is a home located in Crisp County with nearby schools including Crisp County Elementary School, Crisp County Primary School, and Crisp County Middle School.
Ownership History
Date
Name
Owned For
Owner Type
Purchase Details
Closed on
Feb 8, 2013
Sold by
Ameris Bank
Bought by
Arthur Michelle W
Current Estimated Value
Purchase Details
Closed on
Oct 2, 2012
Sold by
Posey Charles L
Bought by
Ameris Bank
Purchase Details
Closed on
Aug 7, 2007
Sold by
Posey Charles L
Bought by
Posey Diane R
Purchase Details
Closed on
Aug 19, 2004
Sold by
Akin John S
Bought by
Posey Charles L
Purchase Details
Closed on
Jul 30, 2003
Sold by
Fitzgerald Chad L and Fitzgerald Sandy J
Bought by
Akin John S
Purchase Details
Closed on
Aug 22, 2002
Sold by
Foshee Barbara M
Bought by
Fitzgerald Chad L and Fitzgerald Sandy J
Purchase Details
Closed on
Apr 4, 2001
Sold by
Canterbury Elliott
Bought by
Foshee Barbara M
Purchase Details
Closed on
Dec 29, 1995
Sold by
Hall Roy and Hall Pat
Bought by
Canterbury Elliott
Purchase Details
Closed on
Jun 25, 1992
Bought by
Hall Roy and Hall Pat
Create a Home Valuation Report for This Property
The Home Valuation Report is an in-depth analysis detailing your home's value as well as a comparison with similar homes in the area
Home Values in the Area
Average Home Value in this Area
Purchase History
| Date | Buyer | Sale Price | Title Company |
|---|---|---|---|
| Arthur Michelle W | $143,250 | -- | |
| Ameris Bank | -- | -- | |
| Posey Diane R | $208,869 | -- | |
| Posey Charles L | $239,000 | -- | |
| Akin John S | $230,000 | -- | |
| Fitzgerald Chad L | $229,000 | -- | |
| Foshee Barbara M | $204,000 | -- | |
| Canterbury Elliott | $170,000 | -- | |
| Hall Roy | $14,000 | -- |
Source: Public Records
Tax History Compared to Growth
Tax History
| Year | Tax Paid | Tax Assessment Tax Assessment Total Assessment is a certain percentage of the fair market value that is determined by local assessors to be the total taxable value of land and additions on the property. | Land | Improvement |
|---|---|---|---|---|
| 2024 | $2,296 | $84,781 | $6,000 | $78,781 |
| 2023 | $2,272 | $80,889 | $6,000 | $74,889 |
| 2022 | $2,162 | $76,998 | $6,000 | $70,998 |
| 2021 | $2,168 | $73,106 | $6,000 | $67,106 |
| 2020 | $2,171 | $73,106 | $6,000 | $67,106 |
| 2019 | $2,157 | $73,106 | $6,000 | $67,106 |
| 2018 | $2,181 | $71,229 | $9,200 | $62,029 |
| 2017 | $2,241 | $72,866 | $9,200 | $63,666 |
| 2016 | $2,238 | $72,866 | $9,200 | $63,666 |
| 2015 | -- | $72,866 | $9,200 | $63,666 |
| 2014 | -- | $72,866 | $9,200 | $63,666 |
| 2013 | -- | $72,865 | $9,200 | $63,665 |
Source: Public Records
Map
Nearby Homes
- 304 Timberland Dr
- 157 Bobwhite Dr
- 2115 Royal Rd
- 1022 E 29th Ave
- 56 Aberdeen Cir
- 49 Aberdeen Cir
- 2298 U S 41
- 724 E 26th Ave
- Lot #13 Lakeview Dr
- 615 E 28th Ave
- 618 E 27th Ave
- 607 E 27th Ave
- 619 E 26th Ave
- TBD Aberdeen Circle Lot#28
- 112 Judy Ave
- 723 E 24th Ave
- 141 Ruby St
- 1403 Georgia 90
- 1101 Schley Ave
- 510 E 25th Ave
- 302 Timberland Dr
- 298 Timberland Dr
- 303 Timberland Dr
- 206 Timberland Dr
- 102 To Be Added
- 102 Oakatee Ct
- 305 Timberland Dr
- 110 Oakatee Ct
- 306 Timberland Dr
- 0 Oakatee Ct
- 403 Timberland Dr
- 101 Oakatee Ct
- 108 Oakatee Ct
- 402 Timberland Dr
- 405 Timberland Dr
- 105 Oakatee Ct
- 118 Timberland Dr
- 605 Timberland Dr
- 166 Kelly Rd
- Lot #1 Timberland Dr