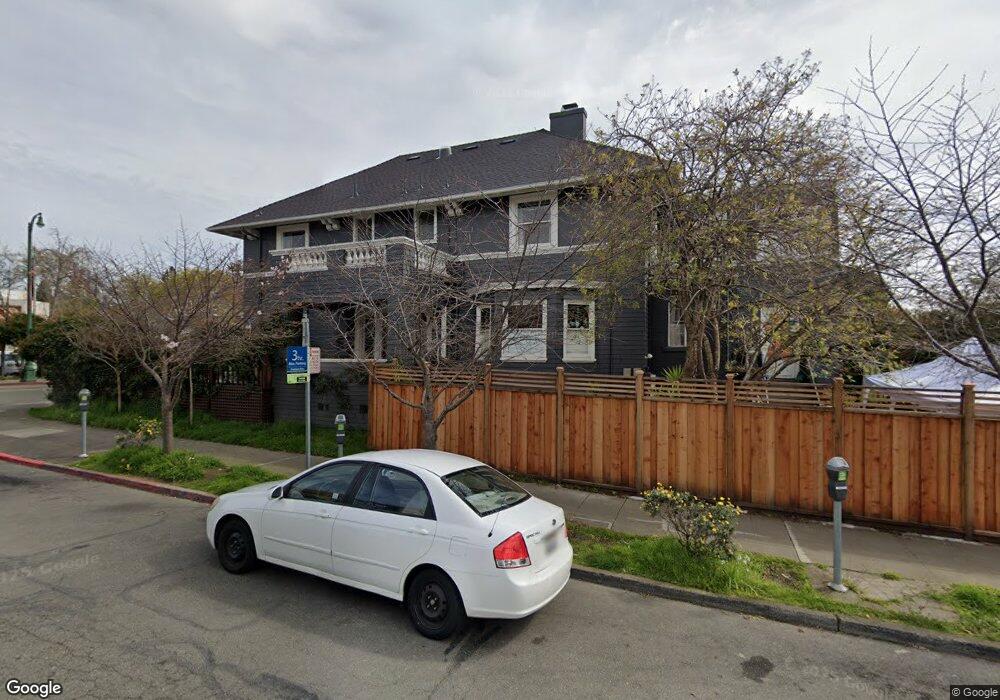
3000 College Ave Berkeley, CA 94705
Elmwood NeighborhoodEstimated Value: $1,635,000 - $2,869,000
4
Beds
5
Baths
3,647
Sq Ft
$607/Sq Ft
Est. Value
About This Home
This home is located at 3000 College Ave, Berkeley, CA 94705 and is currently estimated at $2,213,000, approximately $606 per square foot. 3000 College Ave is a home located in Alameda County with nearby schools including Emerson Elementary School, John Muir Elementary School, and Malcolm X Elementary School.
Ownership History
Date
Name
Owned For
Owner Type
Purchase Details
Closed on
Mar 3, 2015
Sold by
Clark Monika
Bought by
Unique Housing Llc
Current Estimated Value
Purchase Details
Closed on
Aug 24, 2014
Sold by
Clark Nikola S
Bought by
Clark Nikola S and The Rafat Fadel & Nikola S Cla
Purchase Details
Closed on
May 10, 2006
Sold by
Partos Clark Julie
Bought by
Partos Clark Julie V and The Julie V Partos Clark Trust
Purchase Details
Closed on
Mar 21, 2006
Sold by
Clark Robin
Bought by
Partos Clark Julie
Create a Home Valuation Report for This Property
The Home Valuation Report is an in-depth analysis detailing your home's value as well as a comparison with similar homes in the area
Home Values in the Area
Average Home Value in this Area
Purchase History
| Date | Buyer | Sale Price | Title Company |
|---|---|---|---|
| Unique Housing Llc | -- | None Available | |
| Unique Housing Llc | -- | None Available | |
| Unique Housing Llc | -- | None Available | |
| Unique Housing Llc | -- | None Available | |
| Clark Nikola S | -- | None Available | |
| Partos Clark Julie V | -- | None Available | |
| Partos Clark Julie | -- | Chicago Title Co | |
| Partos Clark Julie | $297,454 | Chicago Title Co |
Source: Public Records
Tax History
| Year | Tax Paid | Tax Assessment Tax Assessment Total Assessment is a certain percentage of the fair market value that is determined by local assessors to be the total taxable value of land and additions on the property. | Land | Improvement |
|---|---|---|---|---|
| 2025 | $15,467 | $822,004 | $256,962 | $565,042 |
| 2024 | $15,467 | $805,888 | $251,924 | $553,964 |
| 2023 | $15,118 | $790,091 | $246,986 | $543,105 |
| 2022 | $14,780 | $774,601 | $242,144 | $532,457 |
| 2021 | $14,769 | $759,417 | $237,397 | $522,020 |
| 2020 | $13,797 | $751,633 | $234,964 | $516,669 |
| 2019 | $13,061 | $736,900 | $230,358 | $506,542 |
| 2018 | $12,805 | $722,456 | $225,843 | $496,613 |
| 2017 | $12,344 | $708,294 | $221,416 | $486,878 |
| 2016 | $11,828 | $694,409 | $217,075 | $477,334 |
| 2015 | $11,655 | $683,984 | $213,816 | $470,168 |
| 2014 | $11,792 | $670,587 | $209,628 | $460,959 |
Source: Public Records
Map
Nearby Homes
- 2962 Piedmont Ave
- 2477 Prince St
- 2935 Florence St
- 6446 Colby St
- 2643 Stuart St
- 360 Alcatraz Ave
- 2917 Telegraph Ave
- 2817 Palm Ct
- 2243 Ashby Ave
- 3046 Deakin St
- 2632 Warring St Unit 3
- 2702 Dana St
- 6445 Irwin Ct
- 2319 Ward St
- 2601 College Ave Unit 203
- 2601 College Ave Unit 208
- 2611 Piedmont Ave Unit 4
- 6100 Chabot Rd
- 2923 Wheeler St
- 556 Alcatraz Ave
- 3004 College Ave
- 3006 College Ave
- 2630 Webster St
- 3008 College Ave
- 2641 Webster St
- 2641 Webster St Unit 4
- 2641 Webster St Unit 3
- 2641 Webster St Unit 1
- 3001 Benvenue Ave
- 2992 College Ave
- 3005 Benvenue Ave
- 2635 Webster St
- 3007 Benvenue Ave
- 3012 College Ave
- 3012 College Ave Unit 1
- 3012 College Ave
- 2986 College Ave
- 3011 Benvenue Ave
- 2631 Webster St
- 2700 Webster St
Your Personal Tour Guide
Ask me questions while you tour the home.