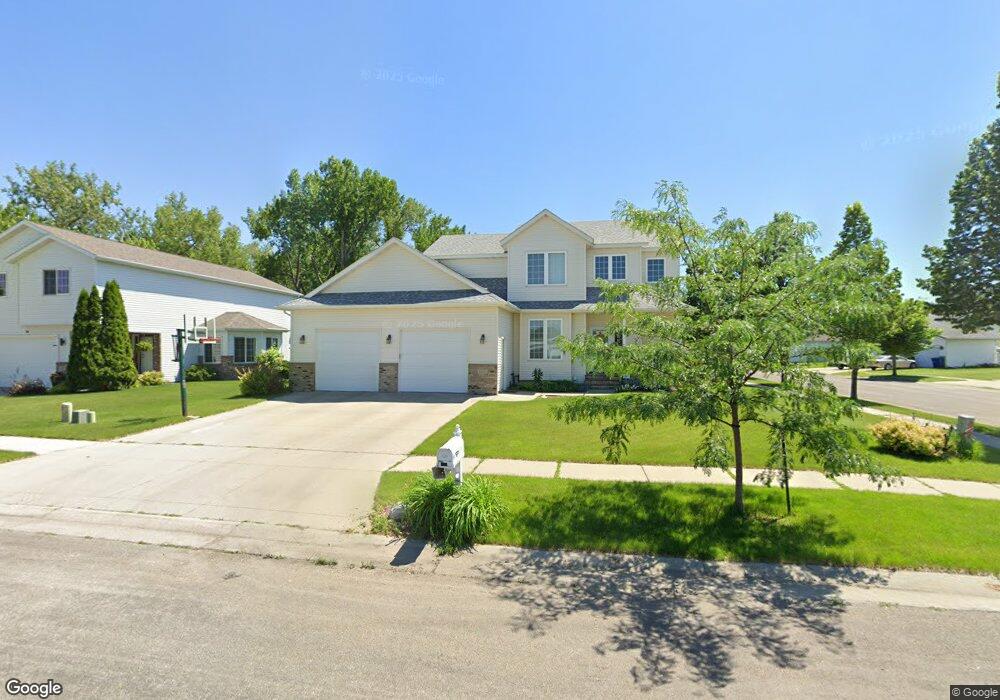
3001 7th Ave N Moorhead, MN 56560
Estimated Value: $361,000 - $399,589
3
Beds
3
Baths
2,005
Sq Ft
$190/Sq Ft
Est. Value
About This Home
This home is located at 3001 7th Ave N, Moorhead, MN 56560 and is currently estimated at $380,147, approximately $189 per square foot. 3001 7th Ave N is a home located in Clay County with nearby schools including R. Asp Elementary School, Horizon Middle School, and Moorhead High School.
Ownership History
Date
Name
Owned For
Owner Type
Purchase Details
Closed on
Jun 30, 2005
Sold by
Kramer Gary D and Kramer Martha A
Bought by
Hiller Ross A and Hiller Dawn L
Current Estimated Value
Home Financials for this Owner
Home Financials are based on the most recent Mortgage that was taken out on this home.
Original Mortgage
$182,400
Outstanding Balance
$95,399
Interest Rate
5.69%
Mortgage Type
New Conventional
Estimated Equity
$284,748
Create a Home Valuation Report for This Property
The Home Valuation Report is an in-depth analysis detailing your home's value as well as a comparison with similar homes in the area
Home Values in the Area
Average Home Value in this Area
Purchase History
| Date | Buyer | Sale Price | Title Company |
|---|---|---|---|
| Hiller Ross A | $228,851 | None Available |
Source: Public Records
Mortgage History
| Date | Status | Borrower | Loan Amount |
|---|---|---|---|
| Open | Hiller Ross A | $182,400 |
Source: Public Records
Tax History Compared to Growth
Tax History
| Year | Tax Paid | Tax Assessment Tax Assessment Total Assessment is a certain percentage of the fair market value that is determined by local assessors to be the total taxable value of land and additions on the property. | Land | Improvement |
|---|---|---|---|---|
| 2025 | $5,798 | $388,100 | $41,500 | $346,600 |
| 2024 | $5,798 | $383,500 | $49,000 | $334,500 |
| 2023 | $6,416 | $368,300 | $49,000 | $319,300 |
| 2022 | $6,112 | $352,800 | $45,300 | $307,500 |
| 2021 | $6,152 | $322,600 | $41,500 | $281,100 |
| 2020 | $6,188 | $318,600 | $41,500 | $277,100 |
| 2019 | $5,768 | $324,800 | $41,500 | $283,300 |
| 2018 | $5,810 | $316,000 | $41,500 | $274,500 |
| 2017 | $5,354 | $314,700 | $40,200 | $274,500 |
| 2016 | $5,498 | $289,400 | $40,200 | $249,200 |
| 2015 | $4,692 | $236,000 | $39,900 | $196,100 |
| 2014 | $4,842 | $236,000 | $39,900 | $196,100 |
Source: Public Records
Map
Nearby Homes