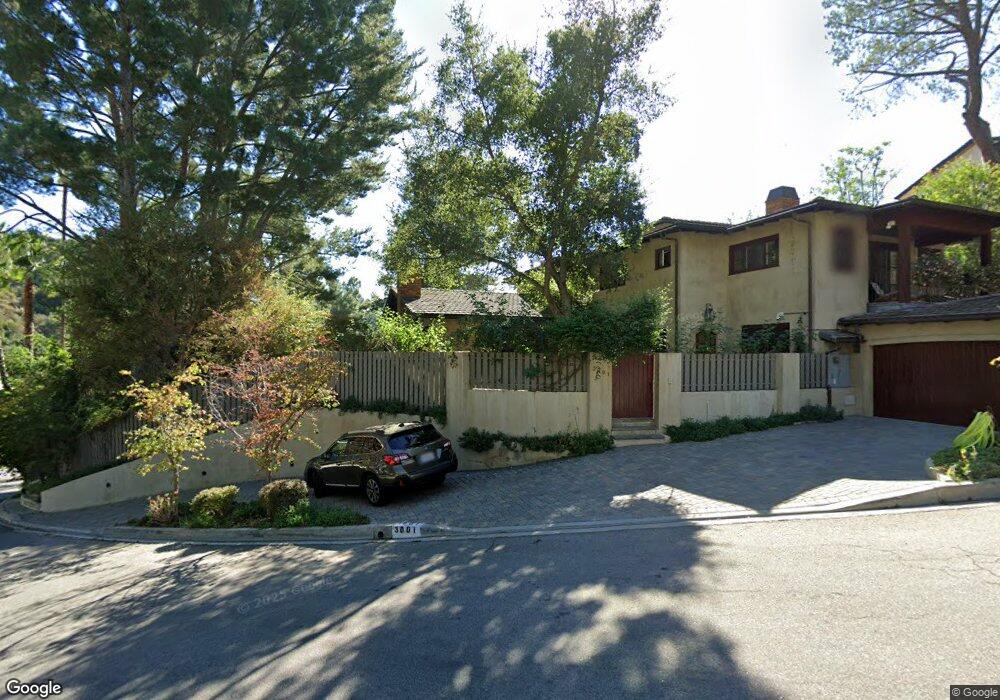
3001 Hutton Dr Beverly Hills, CA 90210
Beverly Crest NeighborhoodEstimated Value: $3,083,000 - $4,303,000
5
Beds
3
Baths
2,844
Sq Ft
$1,257/Sq Ft
Est. Value
About This Home
This home is located at 3001 Hutton Dr, Beverly Hills, CA 90210 and is currently estimated at $3,575,593, approximately $1,257 per square foot. 3001 Hutton Dr is a home located in Los Angeles County with nearby schools including Warner Avenue Elementary and The Buckley School.
Ownership History
Date
Name
Owned For
Owner Type
Purchase Details
Closed on
Jul 2, 2019
Sold by
Arzy Hossein and Bahar Sarvenaz
Bought by
Arzy Hossein and Bahar Sarvenaz
Current Estimated Value
Purchase Details
Closed on
Jan 7, 2003
Sold by
Arzy Hossein and Bahar Sarvenaz
Bought by
Arzy Hossein and Bahar Sarvenaz
Home Financials for this Owner
Home Financials are based on the most recent Mortgage that was taken out on this home.
Original Mortgage
$763,750
Outstanding Balance
$322,959
Interest Rate
6.15%
Estimated Equity
$3,252,634
Purchase Details
Closed on
Nov 14, 1996
Sold by
Kasparian Christine and Christine Kasparian Trust
Bought by
Arzy Hossein and Bahar Sarvenaz
Home Financials for this Owner
Home Financials are based on the most recent Mortgage that was taken out on this home.
Original Mortgage
$472,000
Interest Rate
7.88%
Purchase Details
Closed on
May 2, 1995
Sold by
Kasparian Christine
Bought by
Kasparian Christine and Christine Kasparian Trust
Create a Home Valuation Report for This Property
The Home Valuation Report is an in-depth analysis detailing your home's value as well as a comparison with similar homes in the area
Home Values in the Area
Average Home Value in this Area
Purchase History
| Date | Buyer | Sale Price | Title Company |
|---|---|---|---|
| Arzy Hossein | -- | None Available | |
| Arzy Hossein | -- | None Available | |
| Arzy Hossein | -- | Fidelity National Title Co | |
| Arzy Hossein | $590,000 | -- | |
| Kasparian Christine | -- | -- |
Source: Public Records
Mortgage History
| Date | Status | Borrower | Loan Amount |
|---|---|---|---|
| Open | Arzy Hossein | $763,750 | |
| Closed | Arzy Hossein | $472,000 |
Source: Public Records
Tax History
| Year | Tax Paid | Tax Assessment Tax Assessment Total Assessment is a certain percentage of the fair market value that is determined by local assessors to be the total taxable value of land and additions on the property. | Land | Improvement |
|---|---|---|---|---|
| 2025 | $17,302 | $1,417,393 | $684,972 | $732,421 |
| 2024 | $17,302 | $1,389,602 | $671,542 | $718,060 |
| 2023 | $16,975 | $1,362,356 | $658,375 | $703,981 |
| 2022 | $16,225 | $1,335,644 | $645,466 | $690,178 |
| 2021 | $16,015 | $1,309,456 | $632,810 | $676,646 |
| 2019 | $15,475 | $1,270,619 | $614,042 | $656,577 |
| 2018 | $15,388 | $1,245,705 | $602,002 | $643,703 |
| 2016 | $14,670 | $1,197,335 | $578,627 | $618,708 |
| 2015 | $14,457 | $1,179,351 | $569,936 | $609,415 |
| 2014 | $14,506 | $1,156,250 | $558,772 | $597,478 |
Source: Public Records
Map
Nearby Homes
- 3001 Hutton Place
- 2791 Ellison Dr
- 13355 Mulholland Dr
- 13170 Mulholland Dr
- 2731 Hutton Dr
- 13511 Mulholland Dr
- 3298 Hutton Dr
- 73 Beverly Park Ln
- 2481 Summitridge Dr
- 9706 Hensal Rd
- 9696 Antelope Rd
- 2641 Hutton Dr
- 2870 & 2860 Beverly Dr
- 3110 Benedict Canyon Dr
- 3511 Stonehill Place
- 9705 Oak Pass Rd
- 9716 Oak Pass Rd
- 13388 Newcomb Dr
- 9551 Oak Pass Rd
- 9669 Oak Pass Rd
- 3005 Hutton Dr
- 2985 Hutton Dr
- 9786 Blantyre Dr
- 9789 Blantyre Dr
- 2973 Hutton Dr
- 3013 Hutton Dr
- 2965 Hutton Dr
- 3010 Hutton Dr
- 9787 Blantyre Dr
- 2984 Hutton Dr
- 9778 Blantyre Dr
- 3002 Hutton Place
- 9781 Blantyre Dr
- 2955 Hutton Dr
- 3010 Hutton Place
- 3018 Hutton Place
- 3027 Hutton Dr
- 9772 Blantyre Dr
- 2966 Hutton Dr
- 9773 Blantyre Dr
Your Personal Tour Guide
Ask me questions while you tour the home.