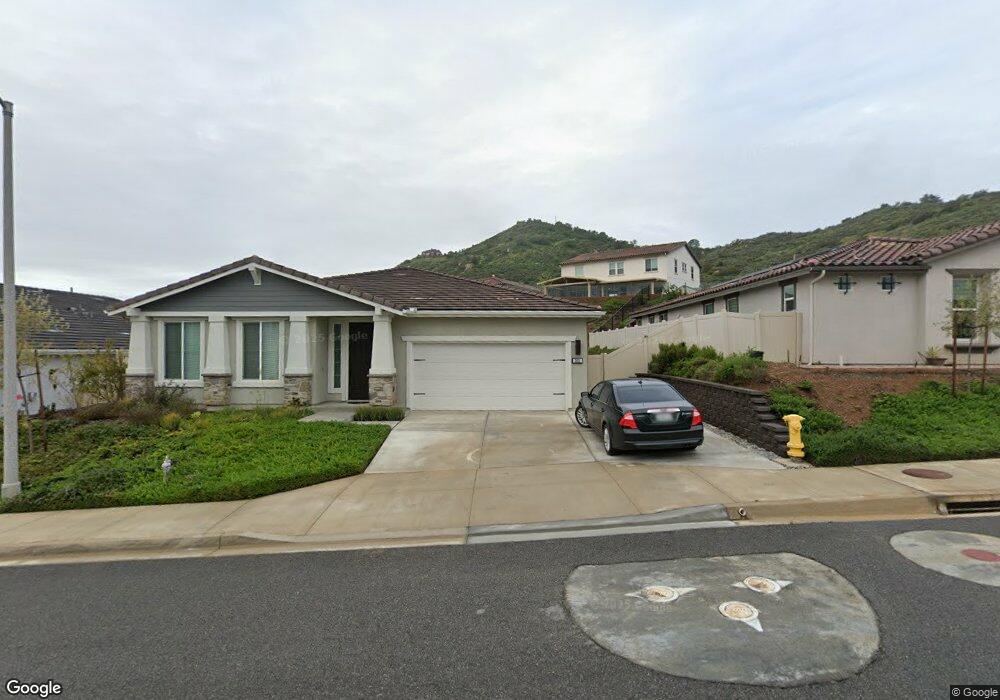
3001 Via de Todos Santos Fallbrook, CA 92028
Estimated Value: $866,000 - $965,000
3
Beds
2
Baths
2,386
Sq Ft
$381/Sq Ft
Est. Value
About This Home
This home is located at 3001 Via de Todos Santos, Fallbrook, CA 92028 and is currently estimated at $908,521, approximately $380 per square foot. 3001 Via de Todos Santos is a home with nearby schools including Bonsall Elementary School, Sullivan Middle School, and Bonsall High.
Ownership History
Date
Name
Owned For
Owner Type
Purchase Details
Closed on
Aug 19, 2020
Sold by
Biro Sheri L
Bought by
Biro Sheri Lynn and Biro Frank
Current Estimated Value
Home Financials for this Owner
Home Financials are based on the most recent Mortgage that was taken out on this home.
Original Mortgage
$525,700
Outstanding Balance
$465,463
Interest Rate
2.9%
Mortgage Type
New Conventional
Estimated Equity
$443,058
Purchase Details
Closed on
Jan 24, 2020
Sold by
Biro Ference
Bought by
Biro Sheri L
Home Financials for this Owner
Home Financials are based on the most recent Mortgage that was taken out on this home.
Original Mortgage
$520,033
Interest Rate
3.73%
Mortgage Type
New Conventional
Purchase Details
Closed on
Jan 9, 2020
Sold by
Beazer Homes Holdings Llc
Bought by
Biro Sheri L
Home Financials for this Owner
Home Financials are based on the most recent Mortgage that was taken out on this home.
Original Mortgage
$520,033
Interest Rate
3.73%
Mortgage Type
New Conventional
Create a Home Valuation Report for This Property
The Home Valuation Report is an in-depth analysis detailing your home's value as well as a comparison with similar homes in the area
Home Values in the Area
Average Home Value in this Area
Purchase History
| Date | Buyer | Sale Price | Title Company |
|---|---|---|---|
| Biro Sheri Lynn | -- | Stewart Title Of California | |
| Biro Sheri L | -- | First American Title Company | |
| Biro Sheri L | $578,000 | First American Title Company |
Source: Public Records
Mortgage History
| Date | Status | Borrower | Loan Amount |
|---|---|---|---|
| Open | Biro Sheri Lynn | $525,700 | |
| Closed | Biro Sheri L | $520,033 |
Source: Public Records
Tax History Compared to Growth
Tax History
| Year | Tax Paid | Tax Assessment Tax Assessment Total Assessment is a certain percentage of the fair market value that is determined by local assessors to be the total taxable value of land and additions on the property. | Land | Improvement |
|---|---|---|---|---|
| 2025 | $6,446 | $631,919 | $218,727 | $413,192 |
| 2024 | $6,446 | $619,530 | $214,439 | $405,091 |
| 2023 | $6,303 | $607,384 | $210,235 | $397,149 |
| 2022 | $6,194 | $595,475 | $206,113 | $389,362 |
| 2021 | $6,089 | $583,800 | $202,072 | $381,728 |
| 2020 | $4,917 | $464,519 | $151,519 | $313,000 |
| 2019 | $1,086 | $100,000 | $100,000 | $0 |
| 2018 | $898 | $80,000 | $80,000 | $0 |
| 2017 | $467 | $40,000 | $40,000 | $0 |
Source: Public Records
Map
Nearby Homes
- 3021 Jicarilla Dr
- 4634 Silent Knoll Dr
- 4309 Diegos Ct
- 4235 Los Padres Dr
- 4320 Los Padres Dr
- 3945 Pala Mesa Dr
- 2543 Daisy Ln
- 34758 Criollo Way
- 739 Meadowood St Unit LOT 333
- 35027 Hacienda Heights Unit LOT 93
- 4434 Brodea Ln
- 256 Hass Ln
- 4408 Brodea Ln
- 312 Zest Ln
- 0 Brodea Ln Unit NDP2506737
- 3264 Shearer Crossing
- 4854 Dulin Rd
- 323 Citrine Trail
- 3976 Lorita Ln
- 35190 Blossom Place
- 2935 Via de Todos Santos
- 3005 Via de Todos Santos
- 3016 Jicarilla Dr
- 3020 Jicarilla Dr
- 3009 Via de Todos Santos
- 2931 Vía de Todos Santos
- 3024 Jicarilla Dr
- 3013 Via de Todos Santos
- 4704 Panache Dr
- 3028 Jicarilla Dr
- 3032 Jicarilla Dr
- 3013 Jicarilla Dr
- 3009 Jicarilla Dr
- 4708 Panache Dr
- 3017 Via de Todos Santos
- 3005 Jicarilla Dr
- 2915 Vía de Todos Santos
- 3017 Jicarilla Dr
- 2919 Vía de Todos Santos
- 3036 Jicarilla Dr