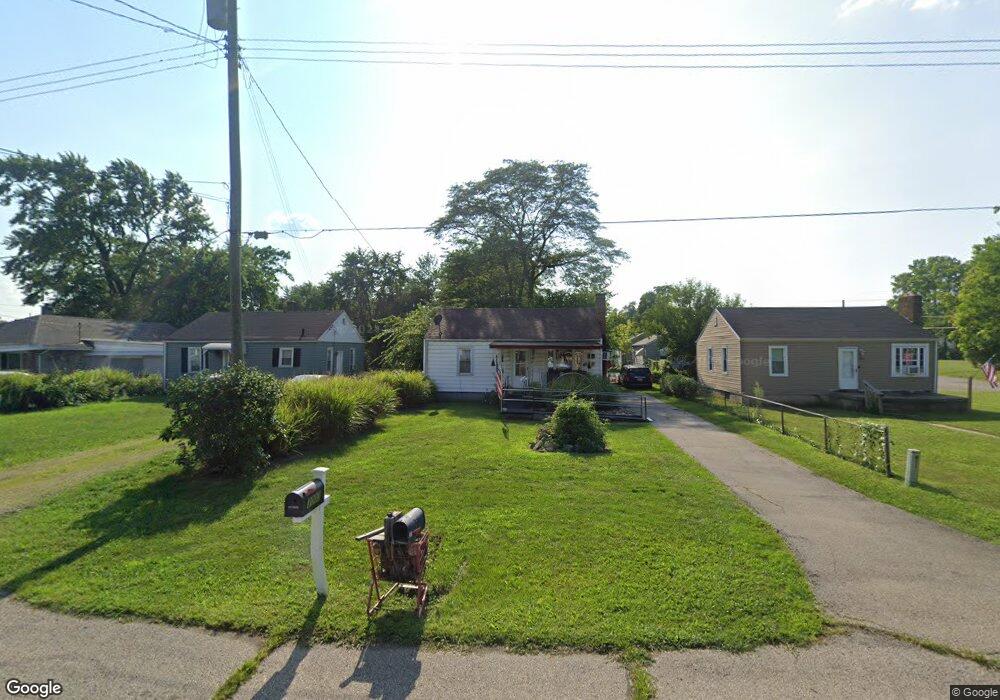
3002 Mohawk St Middletown, OH 45044
Amanda-Oneida NeighborhoodEstimated Value: $65,000 - $96,634
2
Beds
1
Bath
750
Sq Ft
$98/Sq Ft
Est. Value
About This Home
This home is located at 3002 Mohawk St, Middletown, OH 45044 and is currently estimated at $73,659, approximately $98 per square foot. 3002 Mohawk St is a home located in Butler County with nearby schools including Amanda Elementary School, Highview 6th Grade Center, and Middletown Middle School.
Ownership History
Date
Name
Owned For
Owner Type
Purchase Details
Closed on
Oct 23, 2025
Sold by
Ingabrand Bernard Leon and Ingabrand Leon
Bought by
Holland Robin
Current Estimated Value
Home Financials for this Owner
Home Financials are based on the most recent Mortgage that was taken out on this home.
Original Mortgage
$65,475
Outstanding Balance
$65,475
Interest Rate
6.3%
Mortgage Type
New Conventional
Estimated Equity
$8,184
Purchase Details
Closed on
Aug 5, 2023
Sold by
Fries Patricia Ann and Fries Michael H
Bought by
Ingabrand Leon and Ingabrand Bernard Leon
Purchase Details
Closed on
Sep 6, 2022
Sold by
Framstad Jana and Robinson Jerry
Bought by
Ingabrand Bernard Leon
Purchase Details
Closed on
Sep 1, 2022
Sold by
Thier Kathleen Marie
Bought by
Ingabrand Bernard Leon
Purchase Details
Closed on
Aug 31, 2022
Sold by
Earach Joni and Coffey Annette Alee
Bought by
Ingabrand Bernard Leon
Purchase Details
Closed on
Nov 17, 2000
Sold by
Thier John J and Thier Anna Mae
Bought by
Fries Patricia and Thier Kathleen Marie
Create a Home Valuation Report for This Property
The Home Valuation Report is an in-depth analysis detailing your home's value as well as a comparison with similar homes in the area
Home Values in the Area
Average Home Value in this Area
Purchase History
| Date | Buyer | Sale Price | Title Company |
|---|---|---|---|
| Holland Robin | $67,500 | Wave Title | |
| Ingabrand Leon | -- | None Listed On Document | |
| Ingabrand Leon | -- | None Listed On Document | |
| Ingabrand Bernard Leon | -- | None Listed On Document | |
| Ingabrand Bernard Leon | -- | None Listed On Document | |
| Ingabrand Bernard Leon | -- | None Listed On Document | |
| Ingabrand Bernard Leon | -- | None Listed On Document | |
| Ingabrand Bernard Leon | -- | None Listed On Document | |
| Ingabrand Bernard Leon | -- | None Listed On Document | |
| Fries Patricia | -- | -- | |
| Thier John J | -- | -- |
Source: Public Records
Mortgage History
| Date | Status | Borrower | Loan Amount |
|---|---|---|---|
| Open | Holland Robin | $65,475 |
Source: Public Records
Tax History
| Year | Tax Paid | Tax Assessment Tax Assessment Total Assessment is a certain percentage of the fair market value that is determined by local assessors to be the total taxable value of land and additions on the property. | Land | Improvement |
|---|---|---|---|---|
| 2025 | $525 | $19,660 | $3,120 | $16,540 |
| 2024 | $525 | $19,660 | $3,120 | $16,540 |
| 2023 | $539 | $19,470 | $3,120 | $16,350 |
| 2022 | $304 | $13,980 | $3,120 | $10,860 |
| 2021 | $292 | $13,980 | $3,120 | $10,860 |
| 2020 | $304 | $13,980 | $3,120 | $10,860 |
| 2019 | $762 | $10,510 | $3,160 | $7,350 |
| 2018 | $111 | $10,510 | $3,160 | $7,350 |
| 2017 | $111 | $10,510 | $3,160 | $7,350 |
| 2016 | $55 | $9,580 | $3,160 | $6,420 |
| 2015 | $54 | $9,580 | $3,160 | $6,420 |
| 2014 | $358 | $9,580 | $3,160 | $6,420 |
| 2013 | $358 | $14,750 | $3,160 | $11,590 |
Source: Public Records
Map
Nearby Homes
- 3102 Omaha St
- 2804 Yankee Rd
- 1613 Sheridan Ave
- 2924 Seneca St
- 3210 Finley St
- 3221 Yankee Rd
- 3113 Rufus St
- 1505 Pershing Ave
- 3106 Rufus St
- 3209 Seneca St
- 1808 Meadow Ave
- 1621 Lafayette Ave
- 1619 Lafayette Ave
- 3202 Ben Harrison St
- 2216 Carolina St
- 1503 Brown St
- 2237 Carolina St
- 1815 Baltimore St
- 712 Buena Ave
- 3218 Keays Ave
Your Personal Tour Guide
Ask me questions while you tour the home.