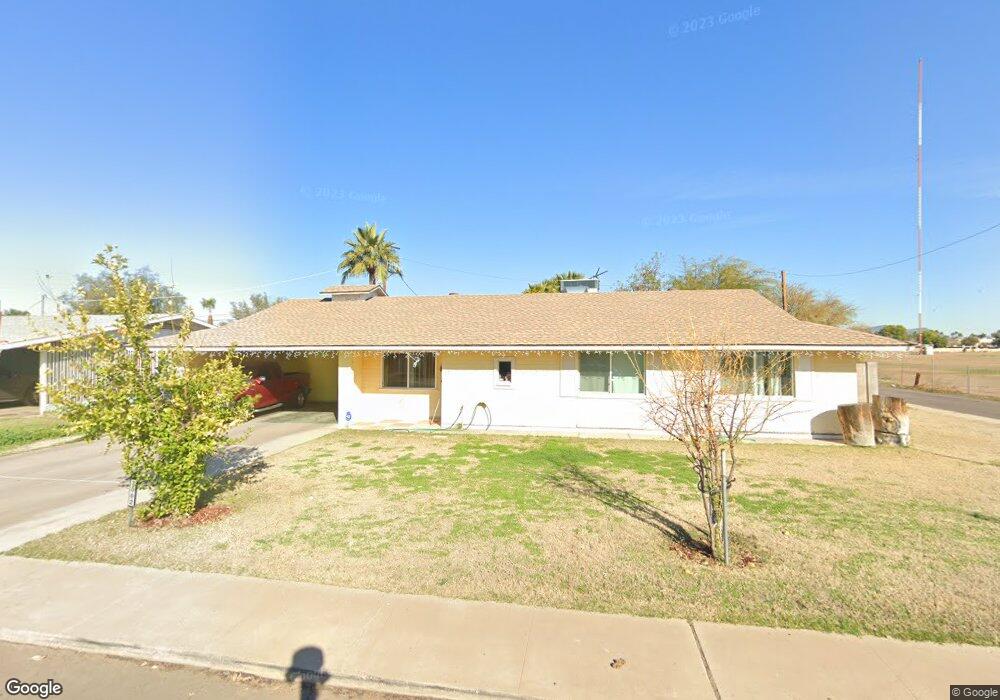
3002 W Tuckey Ln Phoenix, AZ 85017
Grandview NeighborhoodEstimated Value: $311,784 - $373,000
3
Beds
2
Baths
2,106
Sq Ft
$168/Sq Ft
Est. Value
About This Home
This home is located at 3002 W Tuckey Ln, Phoenix, AZ 85017 and is currently estimated at $353,946, approximately $168 per square foot. 3002 W Tuckey Ln is a home located in Maricopa County with nearby schools including Palo Verde Middle School, Ocotillo Elementary School, and Washington High School.
Ownership History
Date
Name
Owned For
Owner Type
Purchase Details
Closed on
May 27, 2004
Sold by
Espinoza Maria Guadalupe
Bought by
Espinoza Rodrigo
Current Estimated Value
Home Financials for this Owner
Home Financials are based on the most recent Mortgage that was taken out on this home.
Original Mortgage
$25,700
Outstanding Balance
$12,555
Interest Rate
5.99%
Mortgage Type
Credit Line Revolving
Estimated Equity
$341,391
Purchase Details
Closed on
Jul 7, 2000
Sold by
Westergard Ivan
Bought by
Westergard Michael James
Home Financials for this Owner
Home Financials are based on the most recent Mortgage that was taken out on this home.
Original Mortgage
$90,000
Interest Rate
7.88%
Mortgage Type
Seller Take Back
Create a Home Valuation Report for This Property
The Home Valuation Report is an in-depth analysis detailing your home's value as well as a comparison with similar homes in the area
Home Values in the Area
Average Home Value in this Area
Purchase History
| Date | Buyer | Sale Price | Title Company |
|---|---|---|---|
| Espinoza Rodrigo | -- | Camelback Title Agency Llc | |
| Espinoza Rodrigo | $128,500 | Camelback Title Agency Llc | |
| Westergard Michael James | $90,000 | Chicago Title Insurance Co |
Source: Public Records
Mortgage History
| Date | Status | Borrower | Loan Amount |
|---|---|---|---|
| Open | Espinoza Rodrigo | $25,700 | |
| Closed | Espinoza Rodrigo | $25,700 | |
| Open | Espinoza Rodrigo | $102,800 | |
| Closed | Espinoza Rodrigo | $102,800 | |
| Previous Owner | Westergard Michael James | $90,000 |
Source: Public Records
Tax History
| Year | Tax Paid | Tax Assessment Tax Assessment Total Assessment is a certain percentage of the fair market value that is determined by local assessors to be the total taxable value of land and additions on the property. | Land | Improvement |
|---|---|---|---|---|
| 2025 | $1,497 | $13,429 | -- | -- |
| 2024 | $1,411 | $12,790 | -- | -- |
| 2023 | $1,411 | $26,500 | $5,300 | $21,200 |
| 2022 | $1,361 | $19,850 | $3,970 | $15,880 |
| 2021 | $1,396 | $18,320 | $3,660 | $14,660 |
| 2020 | $1,358 | $16,670 | $3,330 | $13,340 |
| 2019 | $1,333 | $15,570 | $3,110 | $12,460 |
| 2018 | $1,296 | $14,380 | $2,870 | $11,510 |
| 2017 | $1,292 | $11,960 | $2,390 | $9,570 |
| 2016 | $786 | $9,500 | $1,900 | $7,600 |
| 2015 | $729 | $7,980 | $1,590 | $6,390 |
Source: Public Records
Map
Nearby Homes
- 3030 W Tuckey Ln
- 3001 W Ocotillo Rd
- 3006 W Stella Ln
- 6808 N 30th Dr
- 6813 N 29th Ave
- 6816 N 29th Ln
- 6708 N 31st Ln
- 2808 W Lawrence Rd
- 2724 W Mclellan Blvd Unit 133
- 2724 W Mclellan Blvd Unit 119
- 6715 N 32nd Dr
- 6815 N 32nd Ave
- 2707 W Lamar Rd
- 7001 N 28th Dr
- 2687 W Ocotillo Rd Unit 21
- 6713 N 27th Ave
- 2633 W Ocotillo Rd Unit 3
- 3337 W Ocotillo Rd
- 2629 W Ocotillo Rd Unit 3
- 6132 N 30th Ave
- 3010 W Tuckey Ln
- 3001 W Krall St
- 3009 W Krall St
- 3001 W Tuckey Ln
- 3016 W Tuckey Ln
- 3009 W Tuckey Ln
- 3015 W Krall St
- 3015 W Tuckey Ln
- 3024 W Tuckey Ln
- 3002 W Mclellan Blvd
- 3002 W Krall St
- 3010 W Mclellan Blvd
- 3023 W Krall St
- 3014 W Krall St
- 3023 W Tuckey Ln
- 3016 W Mclellan Blvd
- 3020 W Krall St
- 3029 W Krall St
- 3024 W Mclellan Blvd
- 3026 W Krall St
Your Personal Tour Guide
Ask me questions while you tour the home.