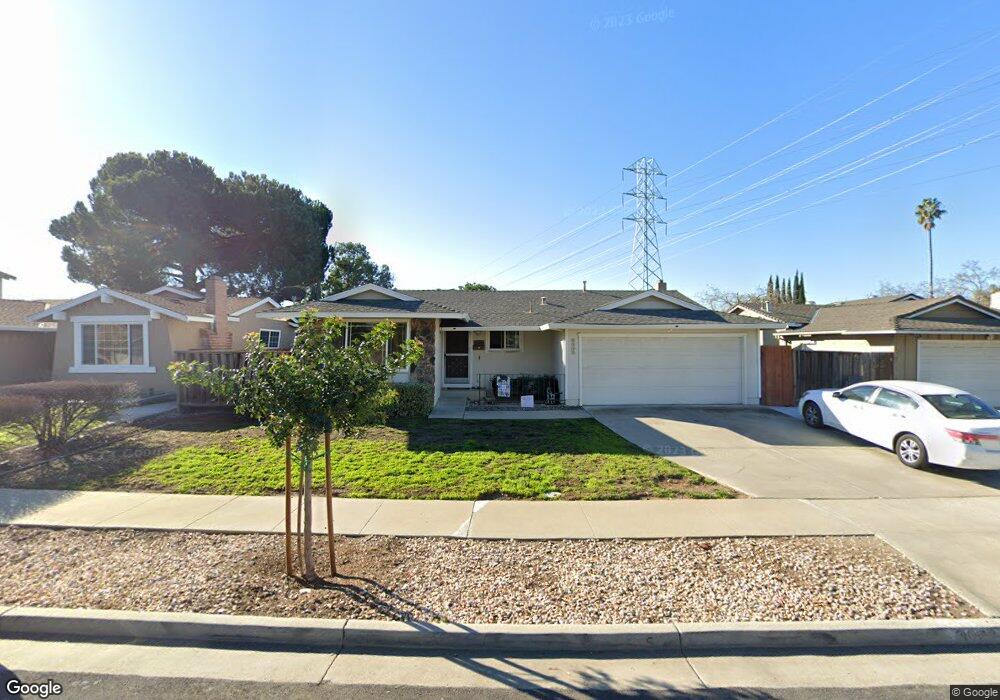
3003 Fenwick Way San Jose, CA 95148
Hidden Glen NeighborhoodEstimated Value: $1,258,764 - $1,401,000
4
Beds
2
Baths
1,457
Sq Ft
$911/Sq Ft
Est. Value
About This Home
This home is located at 3003 Fenwick Way, San Jose, CA 95148 and is currently estimated at $1,326,941, approximately $910 per square foot. 3003 Fenwick Way is a home located in Santa Clara County with nearby schools including Holly Oak Elementary School, George V. Leyva Intermediate School, and Silver Creek High School.
Ownership History
Date
Name
Owned For
Owner Type
Purchase Details
Closed on
Oct 6, 2021
Sold by
Nguyen Tuong T and Nguyen Ann D
Bought by
Nguyen Tuong T and Nguyen Ann D
Current Estimated Value
Home Financials for this Owner
Home Financials are based on the most recent Mortgage that was taken out on this home.
Original Mortgage
$500,000
Interest Rate
2.8%
Mortgage Type
New Conventional
Purchase Details
Closed on
Apr 14, 2021
Sold by
Nguyen Tuong and Nguyen Ann D
Bought by
Nguyen Tuong T and Nguyen Ann D
Purchase Details
Closed on
Sep 27, 2012
Sold by
Nguyen Tuong and Nguyen Ann D
Bought by
Nguyen Tuong and Nguyen Ann D
Home Financials for this Owner
Home Financials are based on the most recent Mortgage that was taken out on this home.
Original Mortgage
$296,000
Interest Rate
3.58%
Mortgage Type
New Conventional
Create a Home Valuation Report for This Property
The Home Valuation Report is an in-depth analysis detailing your home's value as well as a comparison with similar homes in the area
Home Values in the Area
Average Home Value in this Area
Purchase History
| Date | Buyer | Sale Price | Title Company |
|---|---|---|---|
| Nguyen Tuong T | -- | Amrock Inc | |
| Nguyen Tuong T | -- | Amrock Inc | |
| Nguyen Tuong T | -- | None Available | |
| Nguyen Tuong | -- | First American Title Company |
Source: Public Records
Mortgage History
| Date | Status | Borrower | Loan Amount |
|---|---|---|---|
| Closed | Nguyen Tuong T | $500,000 | |
| Closed | Nguyen Tuong | $296,000 |
Source: Public Records
Tax History Compared to Growth
Tax History
| Year | Tax Paid | Tax Assessment Tax Assessment Total Assessment is a certain percentage of the fair market value that is determined by local assessors to be the total taxable value of land and additions on the property. | Land | Improvement |
|---|---|---|---|---|
| 2025 | $5,386 | $299,794 | $121,342 | $178,452 |
| 2024 | $5,386 | $293,916 | $118,963 | $174,953 |
| 2023 | $5,254 | $288,154 | $116,631 | $171,523 |
| 2022 | $5,222 | $282,505 | $114,345 | $168,160 |
| 2021 | $5,089 | $276,966 | $112,103 | $164,863 |
| 2020 | $4,857 | $274,127 | $110,954 | $163,173 |
| 2019 | $4,721 | $268,753 | $108,779 | $159,974 |
| 2018 | $4,645 | $263,485 | $106,647 | $156,838 |
| 2017 | $4,567 | $258,319 | $104,556 | $153,763 |
| 2016 | $4,355 | $253,255 | $102,506 | $150,749 |
| 2015 | $4,360 | $249,452 | $100,967 | $148,485 |
| 2014 | $3,771 | $244,567 | $98,990 | $145,577 |
Source: Public Records
Map
Nearby Homes
- 3211 Pentland Ct
- 2629 Whispering Hills Dr
- 2271 Pumpherston Ct
- 2574 Whispering Hills Cir Unit 2574
- 2021 Bridgecastle Ct
- 2552 Castleton Dr
- 2629 Whispering Hills Cir Unit 2629
- 2114 Bennighof Ct
- 2837 Burdick Way
- 1868 Bagpipe Way
- 2507 Bankhead Way
- 2834 White Acres Dr
- 2991 Vanport Dr
- 2666 Hesselbein Way
- 2680 Chopin Ave
- 000 Gilham Way
- 2955 Vineyard Park Dr
- 2715 Millbrae Way
- 2708 Glen Ferguson Cir
- 3136 Arcola Ct
- 3007 Fenwick Way
- 2999 Fenwick Way
- 2271 Pentland Way
- 3011 Fenwick Way
- 2275 Pentland Way
- 3002 Fenwick Way
- 2980 Fenwick Way
- 3000 Fenwick Way
- 3015 Fenwick Way
- 3008 Fenwick Way
- 3012 Fenwick Way
- 2281 Pentland Way
- 3019 Fenwick Way
- 2976 Fenwick Way
- 2263 Plumstead Ct
- 3016 Fenwick Way
- 2987 Fenwick Way
- 2998 Pettigrew Ct
- 2283 Pentland Way
- 2983 Fenwick Way