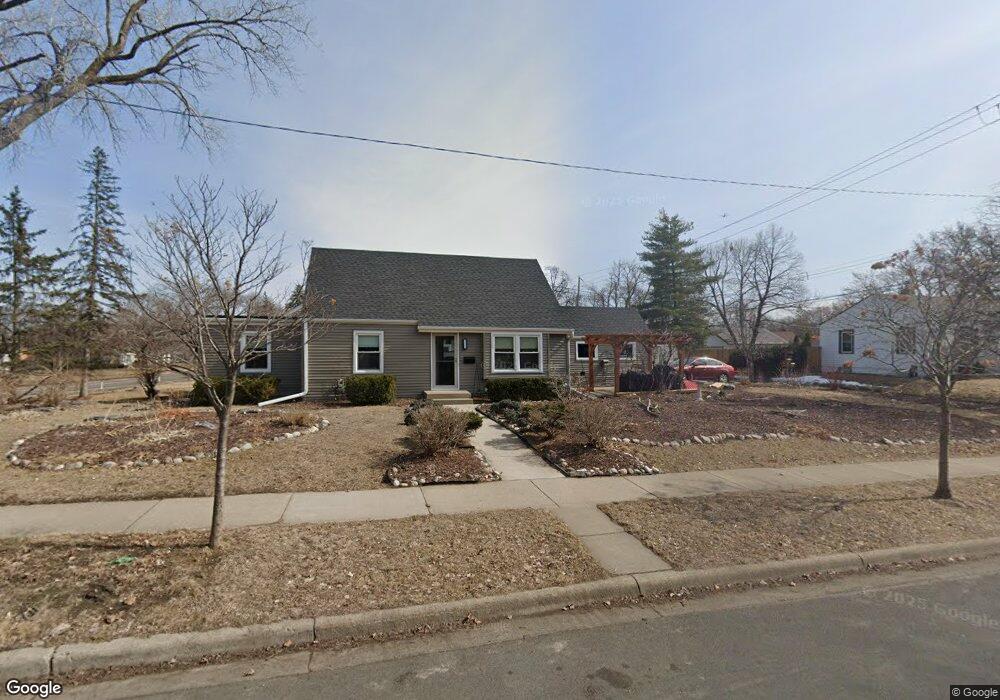
3005 Kentucky Ave S Saint Louis Park, MN 55426
Lenox NeighborhoodEstimated Value: $328,549 - $409,000
3
Beds
1
Bath
1,296
Sq Ft
$284/Sq Ft
Est. Value
About This Home
This home is located at 3005 Kentucky Ave S, Saint Louis Park, MN 55426 and is currently estimated at $368,137, approximately $284 per square foot. 3005 Kentucky Ave S is a home located in Hennepin County with nearby schools including Peter Hobart Elementary School, St. Louis Park Middle School, and St. Louis Park High School.
Ownership History
Date
Name
Owned For
Owner Type
Purchase Details
Closed on
Jul 23, 2020
Sold by
Soderberg Aaron W
Bought by
Soderberg Aaron W and Lijima Janine
Current Estimated Value
Home Financials for this Owner
Home Financials are based on the most recent Mortgage that was taken out on this home.
Original Mortgage
$198,000
Outstanding Balance
$175,573
Interest Rate
3.1%
Mortgage Type
New Conventional
Estimated Equity
$192,564
Purchase Details
Closed on
Feb 25, 2016
Sold by
Buttress Christena W
Bought by
Soderberg Aaron W
Home Financials for this Owner
Home Financials are based on the most recent Mortgage that was taken out on this home.
Original Mortgage
$185,250
Interest Rate
3.92%
Mortgage Type
New Conventional
Purchase Details
Closed on
May 28, 1998
Sold by
Shattuck Lillian L
Bought by
Buttress Christena W
Create a Home Valuation Report for This Property
The Home Valuation Report is an in-depth analysis detailing your home's value as well as a comparison with similar homes in the area
Home Values in the Area
Average Home Value in this Area
Purchase History
| Date | Buyer | Sale Price | Title Company |
|---|---|---|---|
| Soderberg Aaron W | -- | Ancona Title & Escrow Inc | |
| Soderberg Aaron W | $195,000 | Liberty Title Inc | |
| Buttress Christena W | $109,900 | -- |
Source: Public Records
Mortgage History
| Date | Status | Borrower | Loan Amount |
|---|---|---|---|
| Open | Soderberg Aaron W | $198,000 | |
| Closed | Soderberg Aaron W | $185,250 |
Source: Public Records
Tax History Compared to Growth
Tax History
| Year | Tax Paid | Tax Assessment Tax Assessment Total Assessment is a certain percentage of the fair market value that is determined by local assessors to be the total taxable value of land and additions on the property. | Land | Improvement |
|---|---|---|---|---|
| 2024 | $3,701 | $282,700 | $151,100 | $131,600 |
| 2023 | $3,439 | $269,500 | $151,100 | $118,400 |
| 2022 | $3,141 | $269,900 | $150,400 | $119,500 |
| 2021 | $2,844 | $247,800 | $130,800 | $117,000 |
| 2020 | $2,833 | $229,100 | $124,600 | $104,500 |
| 2019 | $2,776 | $220,200 | $118,700 | $101,500 |
| 2018 | $2,667 | $209,800 | $113,100 | $96,700 |
| 2017 | $2,560 | $195,000 | $89,500 | $105,500 |
| 2016 | $3,144 | $225,200 | $80,800 | $144,400 |
| 2015 | $3,281 | $227,500 | $75,600 | $151,900 |
| 2014 | -- | $209,300 | $71,800 | $137,500 |
Source: Public Records
Map
Nearby Homes
- 7217 Minnetonka Blvd
- 3124 Maryland Ave S
- 3101 Nevada Ave S
- 2849 Jersey Ave S
- 3216 Kentucky Ave S
- 3149 Nevada Ave S
- 3153 Nevada Ave S
- 2852 Hampshire Ave S
- 2925 Georgia Ave S
- 3056 Florida Ave S
- 3131 Georgia Ave S
- 3267 Library Ln
- 2910 Edgewood Ave S
- 2732 Idaho Ave S
- 3200 Edgewood Ave S
- 3320 Louisiana Ave S Unit 311
- 3320 Louisiana Ave S Unit 410
- 3320 Louisiana Ave S Unit 310
- 3320 Louisiana Ave S Unit 112
- 3300 Louisiana Ave S Unit 517
- 7013 Minnetonka Blvd
- 7013 Minnetonka Blvd
- 7024 7024 Minnetonka Blvd
- 3017 3017 Kentucky Ave S
- 7101 Minnetonka Blvd
- 7009 Minnetonka Blvd
- 7009 Minnetonka Blvd
- 3021 Kentucky Ave S
- 7008 7008 Minnetonka-Boulevard-
- 7008 7008 Minnetonka Blvd
- 3016 Kentucky Ave S
- 3025 Kentucky Ave S
- 7024 Minnetonka Blvd
- 7105 Minnetonka Blvd
- 3016 Jersey Ave S
- 7016 Minnetonka Blvd
- 7001 Minnetonka Blvd
- 3020 Kentucky Ave S
- 3029 Kentucky Ave S
- 3020 Jersey Ave S