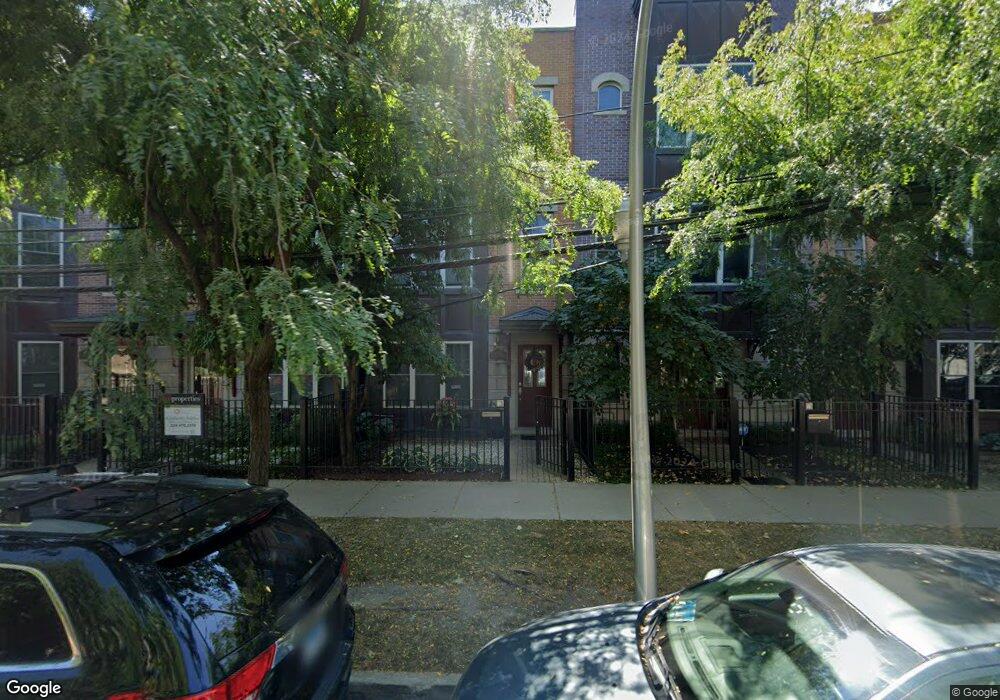
3005 W Cornelia Ave Unit 3 Chicago, IL 60618
Avondale NeighborhoodEstimated Value: $649,570 - $742,000
3
Beds
3
Baths
2,242
Sq Ft
$311/Sq Ft
Est. Value
About This Home
This home is located at 3005 W Cornelia Ave Unit 3, Chicago, IL 60618 and is currently estimated at $697,143, approximately $310 per square foot. 3005 W Cornelia Ave Unit 3 is a home located in Cook County with nearby schools including Linne Elementary School, Schurz High School, and Acero Charter - Carlos Fuentes Cmpus.
Ownership History
Date
Name
Owned For
Owner Type
Purchase Details
Closed on
Nov 25, 2024
Sold by
Lara Lauren
Bought by
Lauren Lara Living Trust and Lara
Current Estimated Value
Purchase Details
Closed on
May 22, 2023
Sold by
Lara Christian and Lara Lauren
Bought by
Lara Lauren
Purchase Details
Closed on
Apr 6, 2020
Sold by
Heckman Lauren and Lara Christian
Bought by
Lara Lauren H and Lara Christian
Home Financials for this Owner
Home Financials are based on the most recent Mortgage that was taken out on this home.
Original Mortgage
$309,000
Interest Rate
3.25%
Mortgage Type
New Conventional
Purchase Details
Closed on
Dec 19, 2008
Sold by
Albany Bank & Trust Company Na
Bought by
Wang Jing
Create a Home Valuation Report for This Property
The Home Valuation Report is an in-depth analysis detailing your home's value as well as a comparison with similar homes in the area
Home Values in the Area
Average Home Value in this Area
Purchase History
| Date | Buyer | Sale Price | Title Company |
|---|---|---|---|
| Lauren Lara Living Trust | -- | None Listed On Document | |
| Lauren Lara Living Trust | -- | None Listed On Document | |
| Lara Lauren | -- | None Listed On Document | |
| Lara Lauren H | -- | Bchh Inc | |
| Wang Jing | $484,000 | Freedom Title Corp |
Source: Public Records
Mortgage History
| Date | Status | Borrower | Loan Amount |
|---|---|---|---|
| Previous Owner | Lara Lauren H | $309,000 |
Source: Public Records
Tax History
| Year | Tax Paid | Tax Assessment Tax Assessment Total Assessment is a certain percentage of the fair market value that is determined by local assessors to be the total taxable value of land and additions on the property. | Land | Improvement |
|---|---|---|---|---|
| 2025 | $9,317 | $53,400 | $6,026 | $47,374 |
| 2024 | $9,317 | $53,400 | $6,026 | $47,374 |
| 2023 | $9,081 | $44,000 | $4,860 | $39,140 |
| 2022 | $9,081 | $44,000 | $4,860 | $39,140 |
| 2021 | $8,877 | $44,000 | $4,860 | $39,140 |
| 2020 | $8,715 | $38,979 | $2,138 | $36,841 |
| 2019 | $8,733 | $43,310 | $2,138 | $41,172 |
| 2018 | $8,555 | $43,310 | $2,138 | $41,172 |
| 2017 | $9,181 | $42,650 | $1,944 | $40,706 |
| 2016 | $8,542 | $42,650 | $1,944 | $40,706 |
| 2015 | $7,815 | $42,650 | $1,944 | $40,706 |
| 2014 | $6,969 | $37,560 | $1,749 | $35,811 |
| 2013 | $6,831 | $37,560 | $1,749 | $35,811 |
Source: Public Records
Map
Nearby Homes
- 3024 W Newport Ave
- 3044 W Roscoe St Unit 2E
- 3354 N Whipple St Unit 1F
- 3354 N Whipple St Unit 1R
- 3404 N Albany Ave
- 3348 N Albany Ave
- 3653 W Barry Ave Unit 1E
- 3653 W Barry Ave Unit 1W
- 3451 N Kedzie Ave
- 3324 N Albany Ave
- 2844 W Addison St Unit P1
- 3657 N Whipple St
- 3721 N Whipple St
- 3646 N California Ave Unit 3
- 3730 N Richmond St
- 3035 W Belmont Ave Unit 2E
- 2913 W Belmont Ave Unit 3A
- 3642 N Sawyer Ave
- 3215 N Elston Ave Unit 3N
- 3748 N Troy St
- 3007 W Cornelia Ave
- 3007 W Cornelia Ave Unit 4
- 3009 W Cornelia Ave
- 3009 W Cornelia Ave Unit 3
- 3009 W Cornelia Ave Unit 5
- 3005 W Cornelia Ave
- 3003 W Cornelia Ave
- 3003 W Cornelia Ave Unit 3003
- 3001 W Cornelia Ave
- 3001 W Cornelia Ave Unit 3005
- 3001 W Cornelia Ave Unit 1
- 3015 W Cornelia Ave
- 3006 W Newport Ave
- 2957 W Cornelia Ave Unit 1
- 2957 W Cornelia Ave Unit 3
- 2957 W Cornelia Ave Unit 4
- 2957 W Cornelia Ave Unit 2
- 3008 W Newport Ave
- 3004 W Newport Ave Unit 43
- 3002 W Newport Ave
Your Personal Tour Guide
Ask me questions while you tour the home.