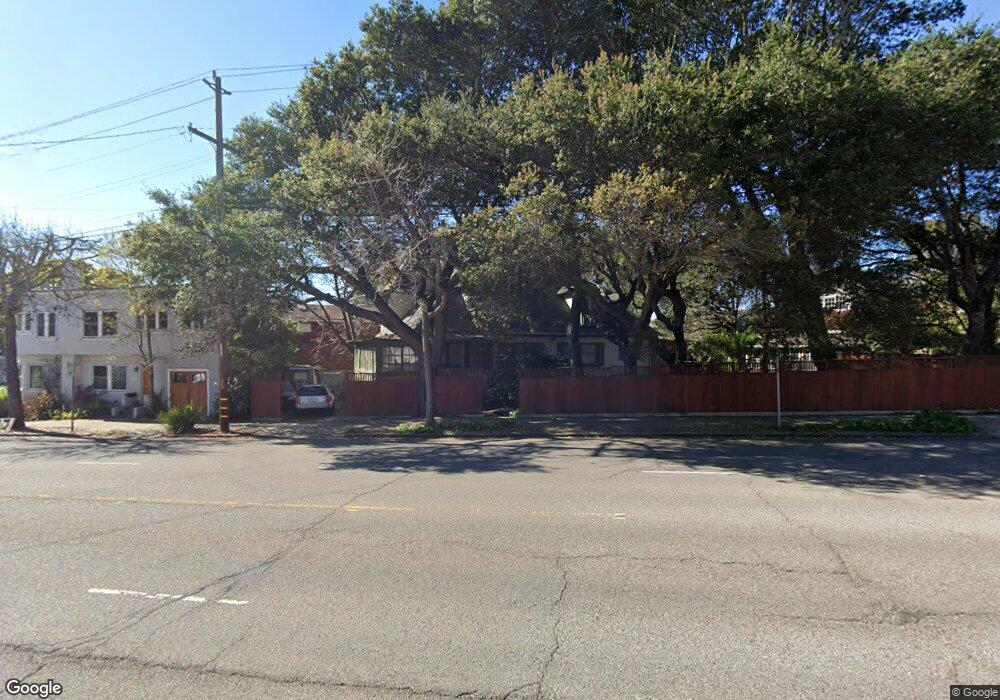
3006 Claremont Ave Berkeley, CA 94705
Elmwood NeighborhoodEstimated Value: $2,176,000 - $4,153,000
9
Beds
4
Baths
3,205
Sq Ft
$922/Sq Ft
Est. Value
About This Home
This home is located at 3006 Claremont Ave, Berkeley, CA 94705 and is currently estimated at $2,956,457, approximately $922 per square foot. 3006 Claremont Ave is a home located in Alameda County with nearby schools including John Muir Elementary School, Emerson Elementary School, and Malcolm X Elementary School.
Ownership History
Date
Name
Owned For
Owner Type
Purchase Details
Closed on
May 15, 2025
Sold by
San Martin Greg Joseph and San Martin Sarah
Bought by
San Martin Gregory Joseph and Kwak Sarah Sunghui
Current Estimated Value
Home Financials for this Owner
Home Financials are based on the most recent Mortgage that was taken out on this home.
Original Mortgage
$300,000
Outstanding Balance
$298,936
Interest Rate
6.64%
Mortgage Type
Credit Line Revolving
Estimated Equity
$2,657,521
Purchase Details
Closed on
Jul 18, 2005
Sold by
Wynhausen Violet E and Wynhausen James P
Bought by
Wynhausen Violet E
Purchase Details
Closed on
Jun 3, 2005
Sold by
Wynhausen Violet E
Bought by
Wynhausen Violet E and Wynhausen James P
Purchase Details
Closed on
Aug 30, 2002
Sold by
Castle Alison
Bought by
Sanmartin Greg and Sanmartin Sarah
Home Financials for this Owner
Home Financials are based on the most recent Mortgage that was taken out on this home.
Original Mortgage
$650,000
Interest Rate
6.16%
Purchase Details
Closed on
Mar 14, 1995
Sold by
Castle Alison and Castle Ursula Cole
Bought by
Castle Alison
Create a Home Valuation Report for This Property
The Home Valuation Report is an in-depth analysis detailing your home's value as well as a comparison with similar homes in the area
Home Values in the Area
Average Home Value in this Area
Purchase History
| Date | Buyer | Sale Price | Title Company |
|---|---|---|---|
| San Martin Gregory Joseph | -- | Chicago Title | |
| Wynhausen Violet E | -- | -- | |
| Wynhausen Violet E | -- | -- | |
| Sanmartin Greg | $850,000 | Old Republic Title Company | |
| Castle Alison | -- | -- |
Source: Public Records
Mortgage History
| Date | Status | Borrower | Loan Amount |
|---|---|---|---|
| Open | San Martin Gregory Joseph | $300,000 | |
| Previous Owner | Sanmartin Greg | $650,000 |
Source: Public Records
Tax History
| Year | Tax Paid | Tax Assessment Tax Assessment Total Assessment is a certain percentage of the fair market value that is determined by local assessors to be the total taxable value of land and additions on the property. | Land | Improvement |
|---|---|---|---|---|
| 2025 | $20,518 | $1,223,970 | $369,291 | $861,679 |
| 2024 | $20,518 | $1,199,837 | $362,051 | $844,786 |
| 2023 | $20,061 | $1,183,182 | $354,954 | $828,228 |
| 2022 | $19,648 | $1,152,985 | $347,995 | $811,990 |
| 2021 | $19,662 | $1,130,248 | $341,174 | $796,074 |
| 2020 | $18,508 | $1,125,594 | $337,678 | $787,916 |
| 2019 | $17,671 | $1,103,528 | $331,058 | $772,470 |
| 2018 | $17,342 | $1,081,896 | $324,569 | $757,327 |
| 2017 | $16,746 | $1,060,688 | $318,206 | $742,482 |
| 2016 | $16,143 | $1,039,897 | $311,969 | $727,928 |
| 2015 | $15,910 | $1,024,283 | $307,285 | $716,998 |
| 2014 | $15,542 | $1,004,223 | $301,267 | $702,956 |
Source: Public Records
Map
Nearby Homes
- 2962 Piedmont Ave
- 2817 Palm Ct
- 2477 Prince St
- 2643 Stuart St
- 204 El Camino Real
- 190 Stonewall Rd
- 360 Alcatraz Ave
- 2632 Warring St Unit 3
- 641 Alvarado Rd
- 6446 Colby St
- 1488 Alvarado Rd
- 2935 Florence St
- 6100 Chabot Rd
- 0 Gravatt Dr Unit 41122154
- 2 Gravatt Dr
- 2917 Telegraph Ave
- 2601 College Ave Unit 203
- 2601 College Ave Unit 208
- 6189 Margarido Dr
- 0 Tunnel Rd
- 2847 Prince St
- 2849 Prince St
- 2862 Webster St
- 2856 Webster St
- 2870 Webster St
- 2845 Prince St
- 2854 Webster St
- 3000 Claremont Ave
- 3000 Claremont Ave
- 3021 Claremont Ave
- 2843 Prince St
- 2850 Webster St
- 3 Oakvale Ave
- 2841 Prince St
- 6 Oakvale Ave
- 3009 Claremont Ave
- 2846 Webster St
- 3025 Claremont Ave
- 8 Oakvale Ave
- 3005 Claremont Ave
Your Personal Tour Guide
Ask me questions while you tour the home.