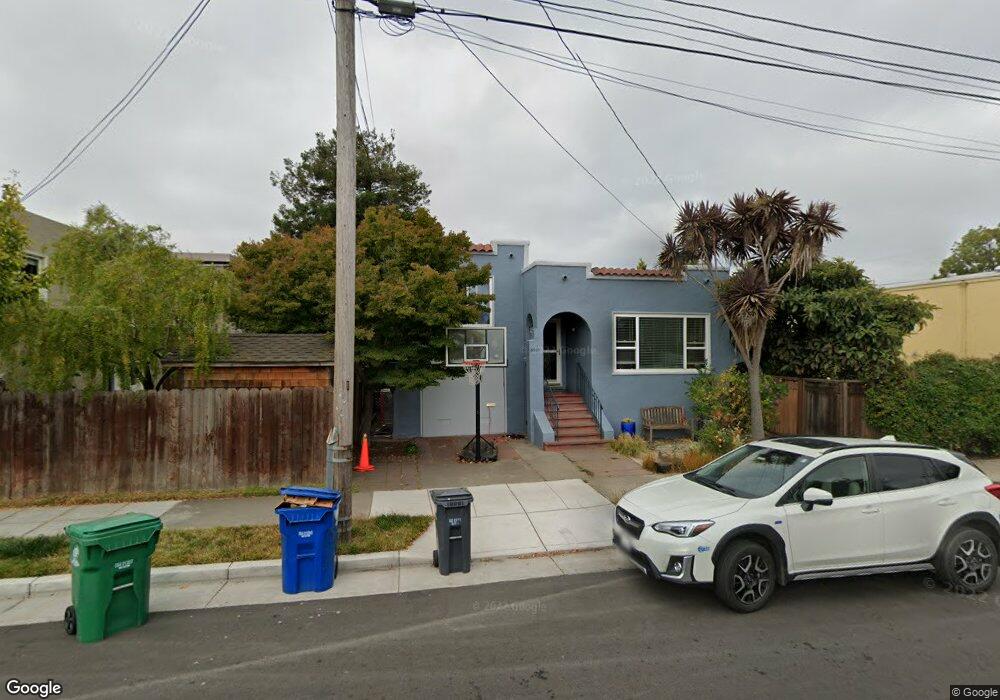
3008 Adams St Alameda, CA 94501
South Shore NeighborhoodEstimated Value: $1,218,947 - $1,449,000
3
Beds
2
Baths
1,510
Sq Ft
$885/Sq Ft
Est. Value
About This Home
This home is located at 3008 Adams St, Alameda, CA 94501 and is currently estimated at $1,336,987, approximately $885 per square foot. 3008 Adams St is a home located in Alameda County with nearby schools including Frank Otis Elementary School, Lincoln Middle School, and Alameda High School.
Ownership History
Date
Name
Owned For
Owner Type
Purchase Details
Closed on
Dec 20, 2012
Sold by
Sherman Sharon B and Raz Jeffrey F
Bought by
Sherman Sharon B and Raz Jeffrey F
Current Estimated Value
Purchase Details
Closed on
Sep 25, 2002
Sold by
Raz Jeffrey F and Sherman Sharon B
Bought by
Raz Jeffrey F and Sherman Sharon B
Home Financials for this Owner
Home Financials are based on the most recent Mortgage that was taken out on this home.
Original Mortgage
$275,000
Interest Rate
6.16%
Mortgage Type
Balloon
Purchase Details
Closed on
Sep 22, 1999
Sold by
Sylvester Suzanne E
Bought by
Raz Jeffrey F and Sherman Sharon B
Home Financials for this Owner
Home Financials are based on the most recent Mortgage that was taken out on this home.
Original Mortgage
$282,400
Interest Rate
7.97%
Create a Home Valuation Report for This Property
The Home Valuation Report is an in-depth analysis detailing your home's value as well as a comparison with similar homes in the area
Home Values in the Area
Average Home Value in this Area
Purchase History
| Date | Buyer | Sale Price | Title Company |
|---|---|---|---|
| Sherman Sharon B | -- | None Available | |
| Raz Jeffrey F | -- | Old Republic Title Company | |
| Raz Jeffrey F | $353,500 | First American Title Guarant |
Source: Public Records
Mortgage History
| Date | Status | Borrower | Loan Amount |
|---|---|---|---|
| Closed | Raz Jeffrey F | $275,000 | |
| Closed | Raz Jeffrey F | $282,400 |
Source: Public Records
Tax History Compared to Growth
Tax History
| Year | Tax Paid | Tax Assessment Tax Assessment Total Assessment is a certain percentage of the fair market value that is determined by local assessors to be the total taxable value of land and additions on the property. | Land | Improvement |
|---|---|---|---|---|
| 2025 | $8,439 | $535,675 | $162,910 | $379,765 |
| 2024 | $8,439 | $525,036 | $159,716 | $372,320 |
| 2023 | $8,132 | $521,606 | $156,585 | $365,021 |
| 2022 | $7,956 | $504,380 | $153,515 | $357,865 |
| 2021 | $7,768 | $494,355 | $150,506 | $350,849 |
| 2020 | $7,676 | $496,217 | $148,963 | $347,254 |
| 2019 | $7,167 | $486,489 | $146,043 | $340,446 |
| 2018 | $6,992 | $476,952 | $143,180 | $333,772 |
| 2017 | $6,685 | $467,602 | $140,373 | $327,229 |
| 2016 | $6,686 | $458,435 | $137,621 | $320,814 |
| 2015 | $6,661 | $451,550 | $135,554 | $315,996 |
| 2014 | $6,371 | $442,705 | $132,899 | $309,806 |
Source: Public Records
Map
Nearby Homes
- 2848 San Jose Ave
- 3208 Washington St
- 3171 Bayview Dr
- 3012 Bayview Dr
- 2620 Encinal Ave
- 1024 Regent St
- 1366 Hansen Ave
- 3215 Liberty Ave
- 1222 Park Ave
- 1100 Park Ave
- 3242 Garfield Ave
- 2431 Roosevelt Dr
- 1213 Park Ave
- 3114 Thompson Ave
- 954 Park St
- 2417 Marti Rae Ct
- 840 Oak St
- 1251 Park St
- 642 Centre Ct
- 641 Centre Ct
- 1115 Fountain St
- 1110 Court St
- 1111 Fountain St
- 1108 Court St
- 1114 Court St
- 3016 Adams St
- 1106 Court St
- 1107 Fountain St
- 3009 Washington St
- 1104 Court St
- 1103 Fountain St
- 1131 Fountain St
- 3007 Adams St
- 1100 Court St
- 1101 Fountain St
- 1124 Court St
- 3009 Adams St
- 1135 Fountain St
- 1128 Court St
- 2916 Adams St