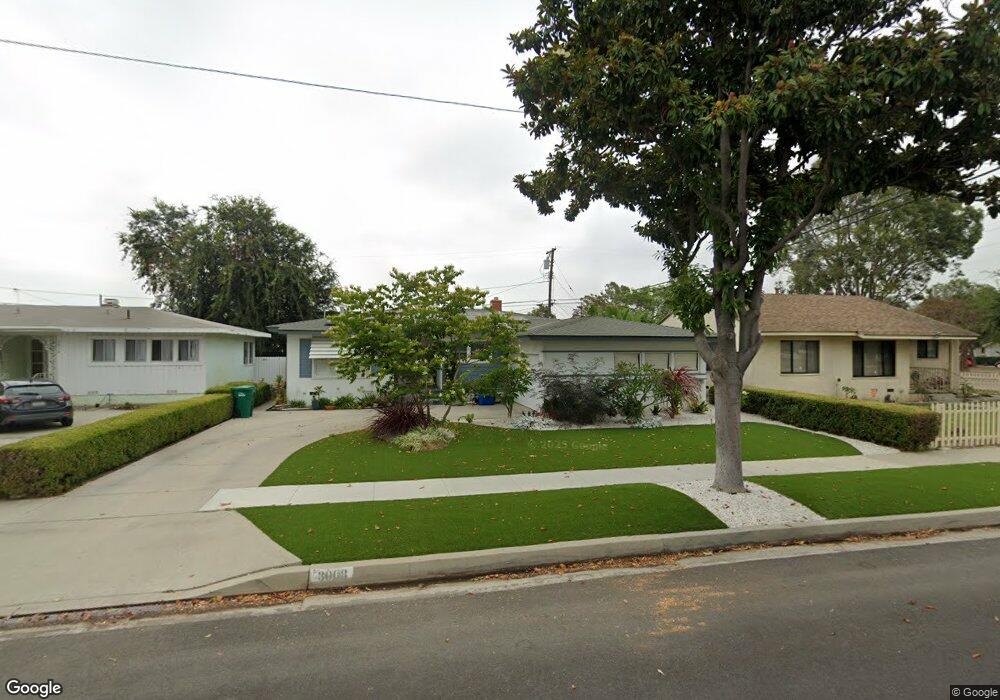
3008 Nipomo Ave Long Beach, CA 90808
Plaza NeighborhoodEstimated Value: $1,030,000 - $1,120,000
3
Beds
2
Baths
1,340
Sq Ft
$803/Sq Ft
Est. Value
About This Home
This home is located at 3008 Nipomo Ave, Long Beach, CA 90808 and is currently estimated at $1,076,611, approximately $803 per square foot. 3008 Nipomo Ave is a home located in Los Angeles County with nearby schools including Cubberley K-8, Millikan High School, and Los Altos Grace Schools.
Ownership History
Date
Name
Owned For
Owner Type
Purchase Details
Closed on
Jan 18, 2018
Sold by
Horn Jessie Amos and Horn Jessie
Bought by
Horn Jessie Amos
Current Estimated Value
Home Financials for this Owner
Home Financials are based on the most recent Mortgage that was taken out on this home.
Original Mortgage
$85,000
Outstanding Balance
$71,712
Interest Rate
3.93%
Mortgage Type
Credit Line Revolving
Estimated Equity
$1,004,899
Purchase Details
Closed on
Feb 14, 2005
Sold by
Lewis Paul Cyrus and Lewis Lea Beth
Bought by
Horn Jesse
Home Financials for this Owner
Home Financials are based on the most recent Mortgage that was taken out on this home.
Original Mortgage
$491,310
Outstanding Balance
$253,657
Interest Rate
5.99%
Mortgage Type
Purchase Money Mortgage
Estimated Equity
$822,954
Purchase Details
Closed on
Feb 4, 1999
Sold by
Lewis Paul C and Dober Lea B
Bought by
Lewis Paul Cyrus and Lewis Lea Beth
Home Financials for this Owner
Home Financials are based on the most recent Mortgage that was taken out on this home.
Original Mortgage
$159,000
Interest Rate
6.7%
Create a Home Valuation Report for This Property
The Home Valuation Report is an in-depth analysis detailing your home's value as well as a comparison with similar homes in the area
Home Values in the Area
Average Home Value in this Area
Purchase History
| Date | Buyer | Sale Price | Title Company |
|---|---|---|---|
| Horn Jessie Amos | -- | First American Title Company | |
| Horn Jesse | $546,000 | North American Title Co | |
| Lewis Paul Cyrus | -- | Stewart Title |
Source: Public Records
Mortgage History
| Date | Status | Borrower | Loan Amount |
|---|---|---|---|
| Open | Horn Jessie Amos | $85,000 | |
| Open | Horn Jesse | $491,310 | |
| Previous Owner | Lewis Paul Cyrus | $159,000 |
Source: Public Records
Tax History
| Year | Tax Paid | Tax Assessment Tax Assessment Total Assessment is a certain percentage of the fair market value that is determined by local assessors to be the total taxable value of land and additions on the property. | Land | Improvement |
|---|---|---|---|---|
| 2025 | $9,870 | $789,032 | $608,852 | $180,180 |
| 2024 | $9,870 | $773,562 | $596,914 | $176,648 |
| 2023 | $9,707 | $758,395 | $585,210 | $173,185 |
| 2022 | $9,104 | $743,526 | $573,736 | $169,790 |
| 2021 | $8,979 | $728,948 | $562,487 | $166,461 |
| 2019 | $8,798 | $707,329 | $545,804 | $161,525 |
| 2018 | $8,198 | $662,000 | $505,000 | $157,000 |
| 2016 | $7,199 | $607,000 | $463,000 | $144,000 |
| 2015 | $6,242 | $543,280 | $416,000 | $127,280 |
| 2014 | $6,097 | $520,000 | $416,000 | $104,000 |
Source: Public Records
Map
Nearby Homes
- 3012 Knoxville Ave
- 3048 Knoxville Ave
- 6442 E Pageantry St
- 3114 Hackett Ave
- 2703 Knoxville Ave
- 6721 E Coralite St
- 6152 E Rosebay St
- 2603 Ladoga Ave
- 6136 E Rosebay St
- 6151 E Wentworth St
- 2518 Vuelta Grande Ave
- 3502 Monogram Ave
- 6829 E Parapet St
- 3426 Roxanne Ave
- 2660 Gondar Ave
- 6110 E Walton St
- 3516 Roxanne Ave
- 3509 Volk Ave
- 2335 Carfax Ave
- 6448 E Los Arcos St
- 3014 Nipomo Ave
- 3002 Nipomo Ave
- 3009 Ostrom Ave
- 3015 Ostrom Ave
- 3003 Ostrom Ave
- 3020 Nipomo Ave
- 3021 Ostrom Ave
- 3009 Nipomo Ave
- 3015 Nipomo Ave
- 3003 Nipomo Ave
- 3026 Nipomo Ave
- 3021 Nipomo Ave
- 3027 Ostrom Ave
- 3027 Nipomo Ave
- 3032 Nipomo Ave
- 3008 Ostrom Ave
- 3033 Ostrom Ave
- 3008 Monogram Ave
- 3014 Ostrom Ave
- 3002 Ostrom Ave
Your Personal Tour Guide
Ask me questions while you tour the home.