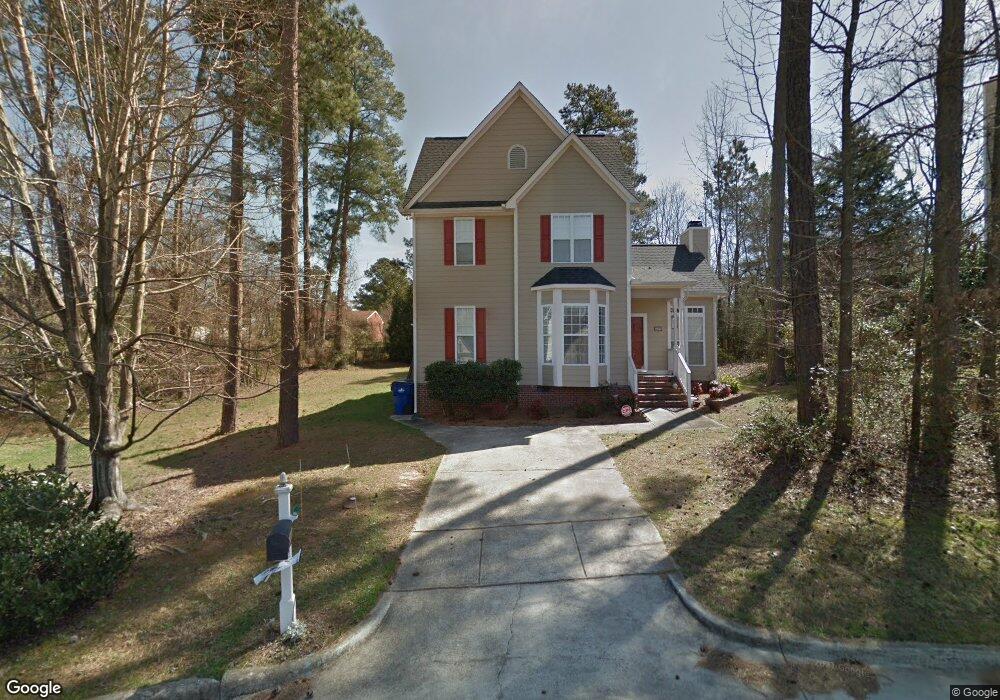
3009 Agent Ct Raleigh, NC 27603
South Raleigh NeighborhoodEstimated Value: $408,000 - $451,000
4
Beds
3
Baths
1,850
Sq Ft
$236/Sq Ft
Est. Value
About This Home
This home is located at 3009 Agent Ct, Raleigh, NC 27603 and is currently estimated at $436,995, approximately $236 per square foot. 3009 Agent Ct is a home located in Wake County with nearby schools including Penny Road Elementary School, Apex Middle, and Apex High School.
Ownership History
Date
Name
Owned For
Owner Type
Purchase Details
Closed on
Jul 28, 2017
Sold by
Mccutcheon Debbie and Mccutcheon Debra L
Bought by
Baxter Adam L and Baxter Sarah E
Current Estimated Value
Home Financials for this Owner
Home Financials are based on the most recent Mortgage that was taken out on this home.
Original Mortgage
$200,000
Outstanding Balance
$166,659
Interest Rate
3.91%
Mortgage Type
New Conventional
Estimated Equity
$270,336
Purchase Details
Closed on
Jul 22, 2013
Sold by
Honeycutt Michelle Coats and Michelle Coats S
Bought by
Mccutcheon Debbie and Mccutcheon Debra L
Home Financials for this Owner
Home Financials are based on the most recent Mortgage that was taken out on this home.
Original Mortgage
$144,000
Interest Rate
4%
Mortgage Type
New Conventional
Purchase Details
Closed on
Dec 10, 1999
Sold by
Bill Clark Homes Of Raleigh Llc
Bought by
Coats S Michelle
Home Financials for this Owner
Home Financials are based on the most recent Mortgage that was taken out on this home.
Original Mortgage
$158,231
Interest Rate
7.99%
Mortgage Type
FHA
Create a Home Valuation Report for This Property
The Home Valuation Report is an in-depth analysis detailing your home's value as well as a comparison with similar homes in the area
Home Values in the Area
Average Home Value in this Area
Purchase History
| Date | Buyer | Sale Price | Title Company |
|---|---|---|---|
| Baxter Adam L | $250,000 | None Available | |
| Mccutcheon Debbie | $180,000 | None Available | |
| Coats S Michelle | $164,000 | -- |
Source: Public Records
Mortgage History
| Date | Status | Borrower | Loan Amount |
|---|---|---|---|
| Open | Baxter Adam L | $200,000 | |
| Previous Owner | Mccutcheon Debbie | $144,000 | |
| Previous Owner | Coats S Michelle | $158,231 |
Source: Public Records
Tax History
| Year | Tax Paid | Tax Assessment Tax Assessment Total Assessment is a certain percentage of the fair market value that is determined by local assessors to be the total taxable value of land and additions on the property. | Land | Improvement |
|---|---|---|---|---|
| 2025 | $3,627 | $413,643 | $135,000 | $278,643 |
| 2024 | $3,612 | $413,643 | $135,000 | $278,643 |
Source: Public Records
Map
Nearby Homes
- 3027 Rennit Ct
- 2509 Valley Haven Dr
- 1626 Bruce Cir
- 1709 Evergreen Ave
- 2602 Crestline Ave
- 1931 Tischer Rd
- 1016 Harper Rd
- 1020 Harper Rd
- 1012 Harper Rd
- 2521 Lake Wheeler Rd
- 1128 Chapanoke Rd
- 2109 Ramsgate St
- 2811 Club Plaza Rd
- 1316 Revolution Cir
- 2020 Quaker Landing Unit 201
- 2617 Farlow Gap Ln
- 1432 Palace Garden Way
- 939 Ileagnes Rd
- 1304 Regulator St
- 3642 Olympia Dr
- 3005 Agent Ct
- 3012 Agent Ct
- 2812 Crestline Ave
- 2806 Crestline Ave
- 3008 Agent Ct
- 3001 Agent Ct
- 2709 Tryon Pines Dr
- 2818 Crestline Ave
- 3004 Agent Ct
- 2800 Crestline Ave
- 3000 Agent Ct
- 2705 Tryon Pines Dr
- 3009 Rennit Ct
- 3015 Rennit Ct
- 2824 Crestline Ave
- 3019 Rennit Ct
- 3005 Rennit Ct
- 2807 Crestline Ave
- 2712 Tryon Pines Dr
- 2701 Tryon Pines Dr
Your Personal Tour Guide
Ask me questions while you tour the home.