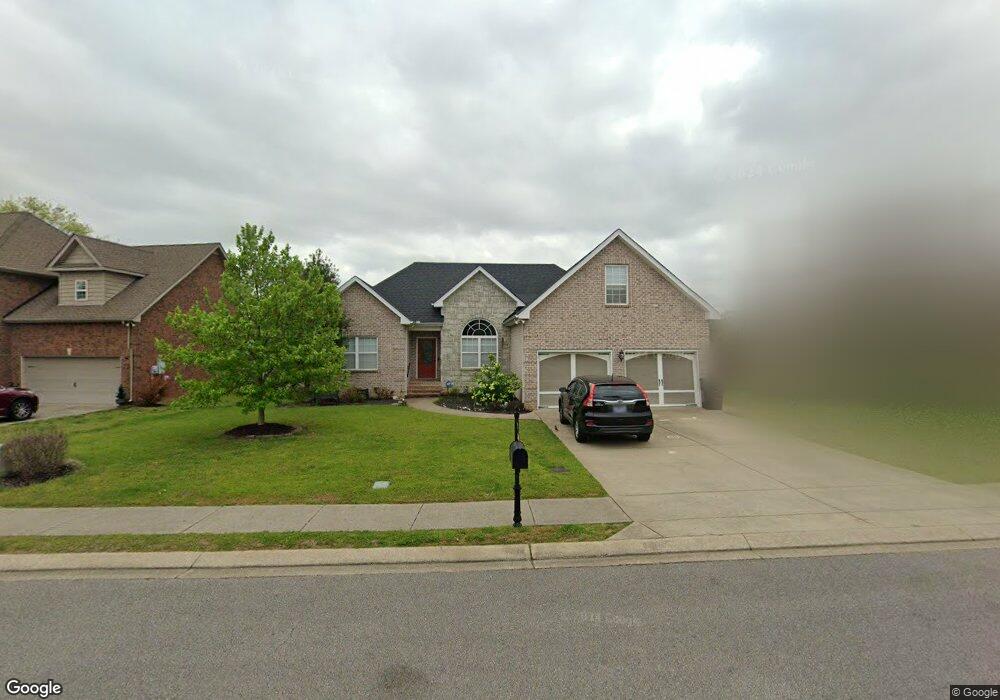
3009 Brookside Path Murfreesboro, TN 37128
Estimated Value: $420,835 - $456,000
Studio
--
Bath
1,942
Sq Ft
$224/Sq Ft
Est. Value
About This Home
This home is located at 3009 Brookside Path, Murfreesboro, TN 37128 and is currently estimated at $434,209, approximately $223 per square foot. 3009 Brookside Path is a home located in Rutherford County with nearby schools including Barfield Elementary School, Salem Elementary School, and Christiana Middle School.
Ownership History
Date
Name
Owned For
Owner Type
Purchase Details
Closed on
Apr 13, 2022
Sold by
Sorrow Charles L and Sorrow Kindra
Bought by
Henley-Bouck Miranda Jo and Bouck Jason Paul
Current Estimated Value
Home Financials for this Owner
Home Financials are based on the most recent Mortgage that was taken out on this home.
Original Mortgage
$328,000
Outstanding Balance
$304,208
Interest Rate
3.76%
Mortgage Type
New Conventional
Estimated Equity
$130,001
Purchase Details
Closed on
May 11, 2021
Sold by
Perrigo Linda and The Ralph And Linda Perrigo Fa
Bought by
Sorrow Charles L and Perrigo Sorrow Kindra
Purchase Details
Closed on
Mar 5, 2021
Sold by
Perrigo Sorrow Kindra
Bought by
Sorrow Charles L and Perrigo Sorrow Kindra
Purchase Details
Closed on
Aug 18, 2020
Sold by
Perrigo Linda
Bought by
Perrigo Sorrow Kindra
Purchase Details
Closed on
Aug 3, 2010
Sold by
Perrigo Ralph D
Bought by
Perrigo Ralph
Purchase Details
Closed on
Feb 26, 2010
Sold by
Stancliff Randall D
Bought by
Perrigo Ralph D
Home Financials for this Owner
Home Financials are based on the most recent Mortgage that was taken out on this home.
Original Mortgage
$136,000
Interest Rate
4.97%
Mortgage Type
Purchase Money Mortgage
Purchase Details
Closed on
Aug 31, 2009
Sold by
Stancliff Bonnie Evelyn
Bought by
Stancliff Randall D
Create a Home Valuation Report for This Property
The Home Valuation Report is an in-depth analysis detailing your home's value as well as a comparison with similar homes in the area
Home Values in the Area
Average Home Value in this Area
Purchase History
| Date | Buyer | Sale Price | Title Company |
|---|---|---|---|
| Henley-Bouck Miranda Jo | $437,000 | Stones River Title | |
| Sorrow Charles L | -- | Tennessee Title Services Llc | |
| Sorrow Charles L | -- | None Available | |
| Perrigo Sorrow Kindra | -- | None Available | |
| Perrigo Ralph | -- | -- | |
| Perrigo Ralph D | $170,000 | -- | |
| Stancliff Randall D | -- | -- |
Source: Public Records
Mortgage History
| Date | Status | Borrower | Loan Amount |
|---|---|---|---|
| Open | Henley-Bouck Miranda Jo | $328,000 | |
| Previous Owner | Stancliff Randall D | $136,000 |
Source: Public Records
Tax History
| Year | Tax Paid | Tax Assessment Tax Assessment Total Assessment is a certain percentage of the fair market value that is determined by local assessors to be the total taxable value of land and additions on the property. | Land | Improvement |
|---|---|---|---|---|
| 2025 | $2,552 | $90,225 | $15,000 | $75,225 |
| 2024 | $2,552 | $90,225 | $15,000 | $75,225 |
| 2023 | $1,693 | $90,225 | $15,000 | $75,225 |
| 2022 | $1,459 | $90,250 | $15,000 | $75,250 |
| 2021 | $1,398 | $63,000 | $12,500 | $50,500 |
| 2020 | $1,398 | $63,000 | $12,500 | $50,500 |
| 2019 | $1,398 | $63,000 | $12,500 | $50,500 |
Source: Public Records
Map
Nearby Homes
- 231 Comer Cir
- 3164 Prater Ct
- 4001 Southridge Blvd
- 106 Daly Dr
- 702 Forest Glen Cir
- 327 Forest Glen Cir
- 189 Red Jacket Trace
- 3236 Prater Ct
- 2765 Windwalker Ct
- 2922 Painted Pony Dr
- 284 Meigs Dr Unit N-3
- 197 Red Jacket Trace
- 644 Village Green Cir
- 903 Crystal Bear Trail
- 369 Chippen Ct
- 2747 Windwalker Ct
- 443 Forest Glen Cir
- 145 Meigs Dr
- 227 White Cloud Trail
- 2981 Taunton Ct
- 3013 Brookside Path
- 3005 Brookside Path
- 3017 Brookside Path
- 240 Danoher Walk
- 3012 Brookside Path
- 3008 Brookside Path
- 3016 Brookside Path
- 211 Innsbrooke Blvd
- 238 Danoher Walk
- 329 Whiteamore Run
- 327 Whiteamore Run Unit 5
- 327 Whiteamore Run Unit 327
- 3021 Brookside Path
- 3004 Brookside Path
- 207 Innsbrooke Blvd
- 207 Innsbrooke Blvd
- 325 Whiteamore Run
- 234 Danoher Walk
- 323 Whiteamore Run
- 215 Innsbrooke Blvd
Your Personal Tour Guide
Ask me questions while you tour the home.