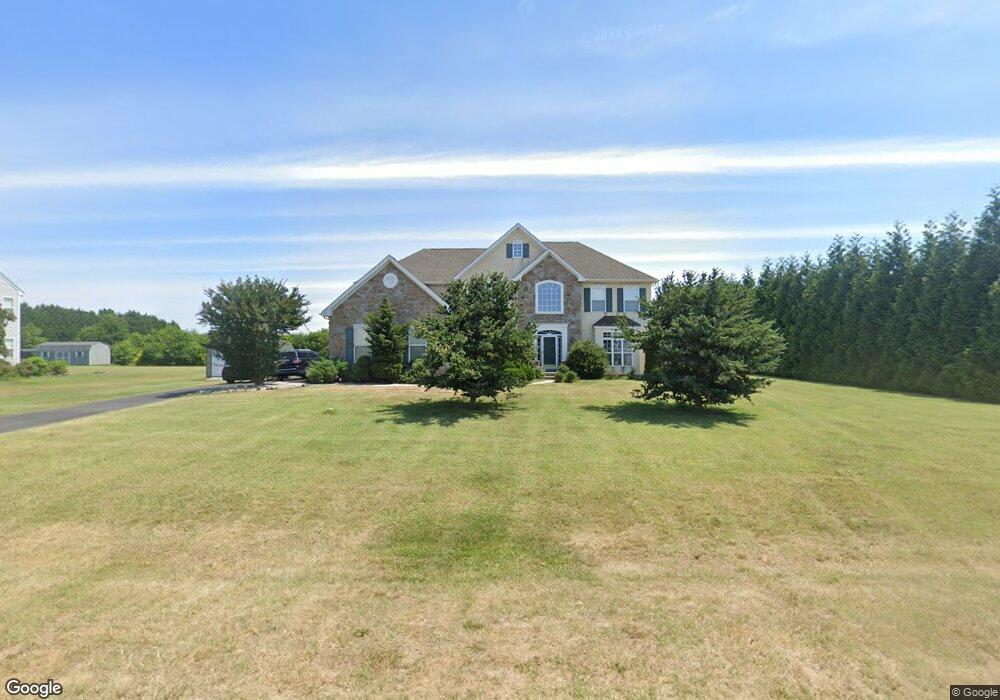
30099 Stage Coach Cir Unit C Milford, DE 19963
Estimated Value: $397,210 - $710,000
3
Beds
2
Baths
3,352
Sq Ft
$185/Sq Ft
Est. Value
About This Home
This home is located at 30099 Stage Coach Cir Unit C, Milford, DE 19963 and is currently estimated at $619,053, approximately $184 per square foot. 30099 Stage Coach Cir Unit C is a home located in Sussex County with nearby schools including Lulu M. Ross Elementary School, Milford Central Academy, and Milford Senior High School.
Ownership History
Date
Name
Owned For
Owner Type
Purchase Details
Closed on
Jun 15, 2019
Sold by
Skinner Marcus Antoine
Bought by
Gambardella Gina M
Current Estimated Value
Purchase Details
Closed on
Jan 10, 2017
Sold by
Central Penn Capital Management Llc
Bought by
Skinner Marcus A
Home Financials for this Owner
Home Financials are based on the most recent Mortgage that was taken out on this home.
Original Mortgage
$289,296
Interest Rate
4.25%
Mortgage Type
FHA
Purchase Details
Closed on
Aug 19, 2016
Sold by
Lee Robert T
Bought by
Central Penn Capital Management Llc
Purchase Details
Closed on
May 30, 2013
Sold by
Cammar Llc
Bought by
Blount Kermit and Blount Ava
Purchase Details
Closed on
May 22, 2013
Sold by
Cammar Llc
Bought by
Blount Kermit and Blount Ava
Create a Home Valuation Report for This Property
The Home Valuation Report is an in-depth analysis detailing your home's value as well as a comparison with similar homes in the area
Home Values in the Area
Average Home Value in this Area
Purchase History
| Date | Buyer | Sale Price | Title Company |
|---|---|---|---|
| Gambardella Gina M | $43,150 | None Listed On Document | |
| Gambardella Gina M | $43,150 | None Listed On Document | |
| Skinner Marcus A | $359,900 | None Available | |
| Central Penn Capital Management Llc | $268,601 | None Available | |
| Blount Kermit | $330,000 | -- | |
| Blount Kermit | $330,000 | -- |
Source: Public Records
Mortgage History
| Date | Status | Borrower | Loan Amount |
|---|---|---|---|
| Previous Owner | Skinner Marcus A | $289,296 | |
| Closed | Blount Kermit | $0 |
Source: Public Records
Tax History Compared to Growth
Tax History
| Year | Tax Paid | Tax Assessment Tax Assessment Total Assessment is a certain percentage of the fair market value that is determined by local assessors to be the total taxable value of land and additions on the property. | Land | Improvement |
|---|---|---|---|---|
| 2025 | $1,581 | $43,150 | $1,750 | $41,400 |
| 2024 | $2,311 | $43,150 | $1,750 | $41,400 |
| 2023 | $2,399 | $43,150 | $1,750 | $41,400 |
| 2022 | $2,363 | $43,150 | $1,750 | $41,400 |
| 2021 | $2,390 | $43,150 | $1,750 | $41,400 |
| 2020 | $2,398 | $43,150 | $1,750 | $41,400 |
| 2019 | $2,417 | $43,150 | $1,750 | $41,400 |
| 2018 | $2,429 | $43,150 | $0 | $0 |
| 2017 | $2,459 | $43,150 | $0 | $0 |
| 2016 | $2,664 | $43,150 | $0 | $0 |
| 2015 | $1,874 | $43,150 | $0 | $0 |
| 2014 | $1,811 | $43,150 | $0 | $0 |
Source: Public Records
Map
Nearby Homes
- 20925 Thawley Ln
- 30036 Stage Coach Cir
- 30045 Stage Coach Cir
- 6401 Cedar Neck Rd
- 322 Matthews Cir
- 7 Meadow Lark Dr
- 7 E Thrush Dr
- 6 Brandywine Rd
- 20626 Smithfield Cir
- 5489 Cedar Neck Rd
- 25 Backwater Ct
- 6 Homestead Blvd
- 10 Homestead Blvd
- 19 W Saratoga Rd
- 25 Homestead Blvd
- 5101 Stone Chase Way
- 4903 Pebble Ln Unit I
- 4903 Pebble Ln Unit L
- 4903 Pebble Ln Unit K
- 4903 Pebble Ln Unit J
- 30099 Stage Coach Cir Unit E
- 30099 Stage Coach Cir Unit B
- 30099 Stage Coach Cir Unit A
- 30099 Stage Coach Cir Unit D
- 30099 Stage Coach Cir Unit F
- 30099 Stage Coach Cir Unit G
- 30099 Stage Coach Cir
- 30097 Stage Coach Cir
- 30102 Stage Coach Cir
- 30096 Stage Coach Cir
- 30101 Stage Coach Cir
- 0 Stage Coach Cir Unit 1001727268
- 0 Stage Coach Cir Unit 1001198278
- 0 Stage Coach Cir Unit 1001158966
- 0 Stage Coach Cir Unit 1001001146
- 0 Stage Coach Cir Unit 1001001130
- 0 Stage Coach Cir Unit 1001369722
- 0 Stage Coach Cir Unit 6359869
- 0 Stage Coach Cir Unit 6217815
- 0 Stage Coach Cir Unit 6064526