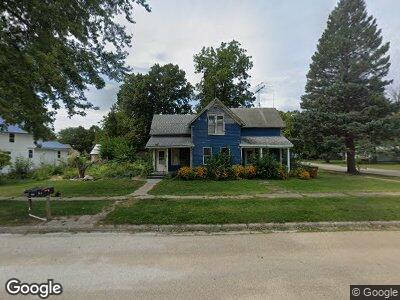
301 3rd St S Albert City, IA 50510
Estimated Value: $54,882 - $93,000
4
Beds
1
Bath
1,280
Sq Ft
$59/Sq Ft
Est. Value
About This Home
This home is located at 301 3rd St S, Albert City, IA 50510 and is currently estimated at $75,221, approximately $58 per square foot. 301 3rd St S is a home located in Buena Vista County.
Ownership History
Date
Name
Owned For
Owner Type
Purchase Details
Closed on
Oct 15, 2024
Sold by
Jarvis Tyler R and Jarvis Amanda H
Bought by
Ansbro Joshua
Current Estimated Value
Purchase Details
Closed on
Apr 24, 2020
Sold by
Ekc Partnership
Bought by
Jarvis Tyler R and Jarvis Amanda H
Home Financials for this Owner
Home Financials are based on the most recent Mortgage that was taken out on this home.
Original Mortgage
$18,000
Interest Rate
3.6%
Mortgage Type
New Conventional
Purchase Details
Closed on
Jun 17, 2011
Sold by
Estate Ofardelle M Valentine
Bought by
Ekc Partnership
Create a Home Valuation Report for This Property
The Home Valuation Report is an in-depth analysis detailing your home's value as well as a comparison with similar homes in the area
Home Values in the Area
Average Home Value in this Area
Purchase History
| Date | Buyer | Sale Price | Title Company |
|---|---|---|---|
| Ansbro Joshua | $28,000 | None Listed On Document | |
| Jarvis Tyler R | $22,500 | None Available | |
| Ekc Partnership | $25,000 | -- |
Source: Public Records
Mortgage History
| Date | Status | Borrower | Loan Amount |
|---|---|---|---|
| Previous Owner | Jarvis Tyler R | $18,000 | |
| Previous Owner | Jarvis Tyler R | $18,000 |
Source: Public Records
Tax History Compared to Growth
Tax History
| Year | Tax Paid | Tax Assessment Tax Assessment Total Assessment is a certain percentage of the fair market value that is determined by local assessors to be the total taxable value of land and additions on the property. | Land | Improvement |
|---|---|---|---|---|
| 2024 | $393 | $44,530 | $8,080 | $36,450 |
| 2023 | $502 | $44,530 | $8,080 | $36,450 |
| 2022 | $473 | $35,990 | $8,080 | $27,910 |
| 2021 | $475 | $35,990 | $8,080 | $27,910 |
| 2020 | $611 | $33,500 | $8,080 | $25,420 |
| 2019 | $488 | $33,500 | $8,080 | $25,420 |
| 2018 | $490 | $26,540 | $6,300 | $20,240 |
| 2017 | $452 | $26,540 | $6,300 | $20,240 |
| 2016 | $418 | $24,380 | $6,300 | $18,080 |
| 2015 | $418 | $23,440 | $0 | $0 |
| 2014 | $402 | $23,440 | $0 | $0 |
Source: Public Records
Map
Nearby Homes