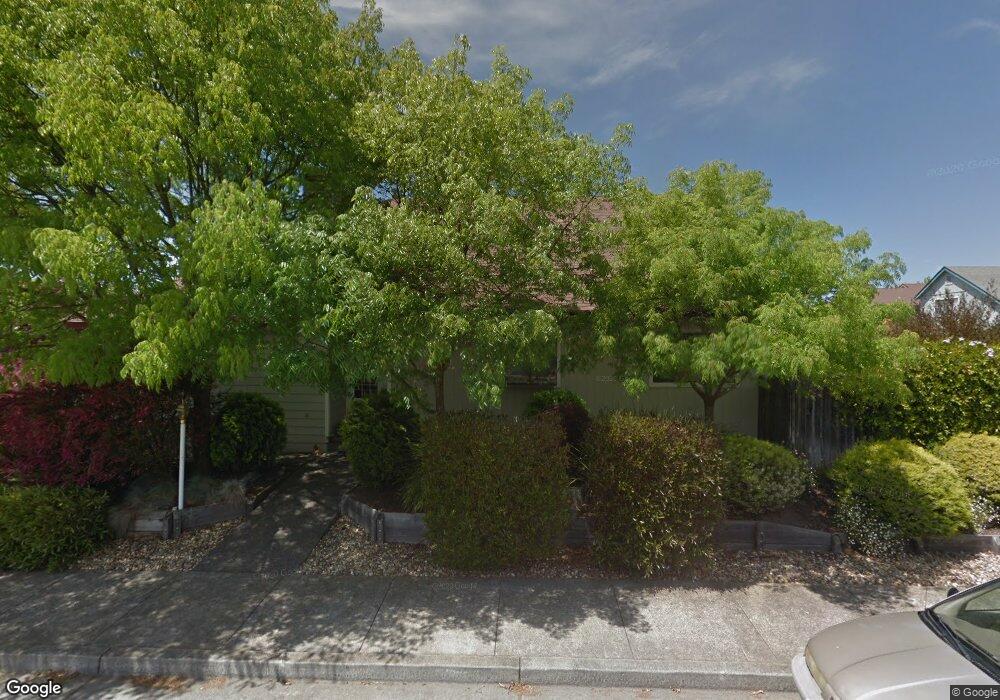
301 Broad Oak Way Windsor, CA 95492
Estimated Value: $797,701 - $823,000
4
Beds
3
Baths
1,966
Sq Ft
$412/Sq Ft
Est. Value
About This Home
This home is located at 301 Broad Oak Way, Windsor, CA 95492 and is currently estimated at $809,425, approximately $411 per square foot. 301 Broad Oak Way is a home located in Sonoma County with nearby schools including Mattie Washburn Elementary School, Brooks Elementary School, and Windsor Middle School.
Ownership History
Date
Name
Owned For
Owner Type
Purchase Details
Closed on
Jan 6, 2016
Sold by
Broad Oak Properties Llc
Bought by
Avila Salvador and Joachin Nataly
Current Estimated Value
Home Financials for this Owner
Home Financials are based on the most recent Mortgage that was taken out on this home.
Original Mortgage
$471,306
Outstanding Balance
$378,356
Interest Rate
4.25%
Mortgage Type
FHA
Estimated Equity
$431,069
Purchase Details
Closed on
Aug 24, 2009
Sold by
Levinson Robert J and Levinson Priscilla G
Bought by
Broad Oak Properties Llc
Purchase Details
Closed on
Sep 15, 2008
Sold by
Ostic James P and Ostic Jennifer
Bought by
Levinson Robert J and Levinson Priscilla G
Purchase Details
Closed on
Dec 24, 1998
Sold by
Powell Jon
Bought by
Ostic James P and Ostic Jennifer
Home Financials for this Owner
Home Financials are based on the most recent Mortgage that was taken out on this home.
Original Mortgage
$176,800
Interest Rate
6.82%
Create a Home Valuation Report for This Property
The Home Valuation Report is an in-depth analysis detailing your home's value as well as a comparison with similar homes in the area
Home Values in the Area
Average Home Value in this Area
Purchase History
| Date | Buyer | Sale Price | Title Company |
|---|---|---|---|
| Avila Salvador | $480,000 | Fidelity National Title Co | |
| Broad Oak Properties Llc | -- | Fidelity National Title Comp | |
| Levinson Robert J | $395,000 | Chicago Title Company | |
| Ostic James P | $221,000 | Fidelity National Title Co |
Source: Public Records
Mortgage History
| Date | Status | Borrower | Loan Amount |
|---|---|---|---|
| Open | Avila Salvador | $471,306 | |
| Previous Owner | Ostic James P | $176,800 |
Source: Public Records
Tax History
| Year | Tax Paid | Tax Assessment Tax Assessment Total Assessment is a certain percentage of the fair market value that is determined by local assessors to be the total taxable value of land and additions on the property. | Land | Improvement |
|---|---|---|---|---|
| 2025 | $6,783 | $568,217 | $224,917 | $343,300 |
| 2024 | $6,783 | $557,076 | $220,507 | $336,569 |
| 2023 | $6,783 | $546,154 | $216,184 | $329,970 |
| 2022 | $6,537 | $535,446 | $211,946 | $323,500 |
| 2021 | $6,433 | $524,948 | $207,791 | $317,157 |
| 2020 | $6,575 | $519,566 | $205,661 | $313,905 |
| 2019 | $6,539 | $509,379 | $201,629 | $307,750 |
| 2018 | $6,472 | $499,392 | $197,676 | $301,716 |
| 2017 | $6,412 | $489,600 | $193,800 | $295,800 |
| 2016 | $4,742 | $370,734 | $130,847 | $239,887 |
| 2015 | $4,613 | $365,166 | $128,882 | $236,284 |
| 2014 | $4,544 | $358,014 | $126,358 | $231,656 |
Source: Public Records
Map
Nearby Homes
- 333 Cornell Stree
- 203 Cockrobin Ave
- 172 Cornell St
- 8109 B St
- 719 Hackberry Ct
- 8147 Willow St
- 8156 D St
- 8148 D St
- 140 Billington Ln
- 6516 Hwy
- 230 Courtyards E
- 8145 Willow St
- 1038 Capewood Ln
- 8182 Willow St
- 1138 Broadleaf Ln
- 106 Courtyards E
- 125 Anish Way
- 179 Pleasant Ave
- 1276 Jensen Ln Unit LOT 2
- 1276 Jensen Ln Unit LOT 1
- 307 Broad Oak Way
- 313 Broad Oak Way
- 8041 Creekside Dr
- 8047 Creekside Dr
- 8006 Creekside Dr
- 8000 Creekside Dr
- 8012 Creekside Dr
- 319 Broad Oak Way
- 8053 Creekside Dr
- 300 Broad Oak Way
- 8018 Creekside Dr
- 7994 Creekside Dr
- 306 Broad Oak Way
- 8059 Creekside Dr
- 312 Broad Oak Way
- 325 Broad Oak Way
- 8024 Creekside Dr
- 7988 Creekside Dr
- 240 Usher Dr
- 318 Broad Oak Way
Your Personal Tour Guide
Ask me questions while you tour the home.