Estimated Value: $308,277 - $349,000
3
Beds
2
Baths
1,790
Sq Ft
$186/Sq Ft
Est. Value
About This Home
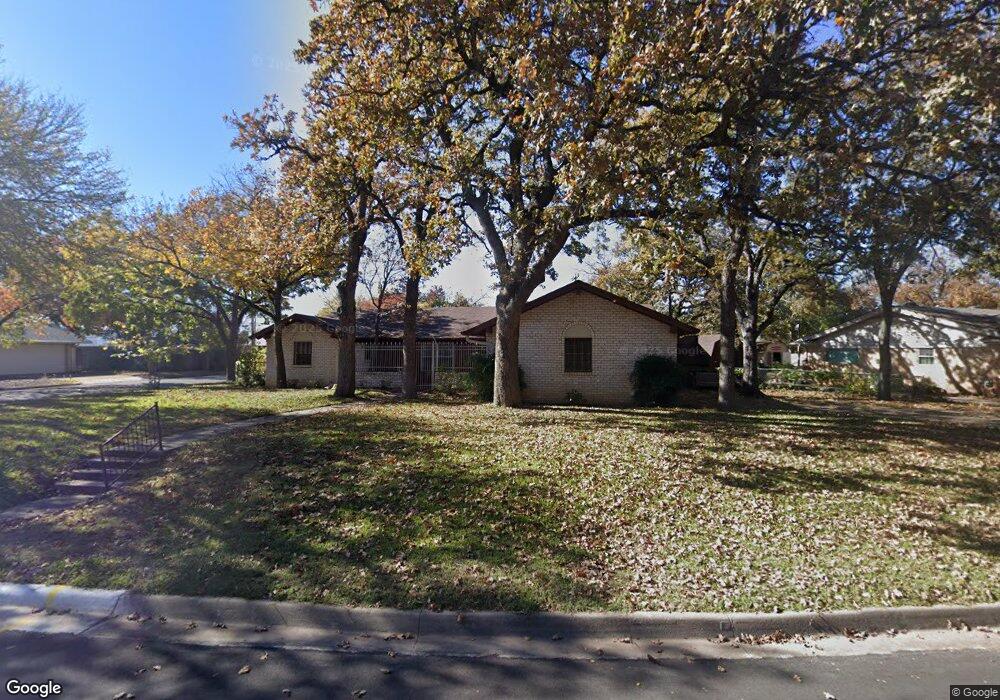
This home is located at 301 Cooper Dr, Hurst, TX 76053 and is currently estimated at $332,319, approximately $185 per square foot. 301 Cooper Dr is a home located in Tarrant County with nearby schools including Jack C Binion Elementary School, Richland Middle School, and Birdville High School.
Ownership History
Date
Name
Owned For
Owner Type
Purchase Details
Closed on
Oct 4, 2006
Sold by
Brown W E and Brown Doretta W
Bought by
Brown Wendall E and Brown Doretta W
Current Estimated Value
Create a Home Valuation Report for This Property
The Home Valuation Report is an in-depth analysis detailing your home's value as well as a comparison with similar homes in the area
Home Values in the Area
Average Home Value in this Area
Purchase History
| Date | Buyer | Sale Price | Title Company |
|---|---|---|---|
| Brown Wendall E | -- | None Available |
Source: Public Records
Tax History
| Year | Tax Paid | Tax Assessment Tax Assessment Total Assessment is a certain percentage of the fair market value that is determined by local assessors to be the total taxable value of land and additions on the property. | Land | Improvement |
|---|---|---|---|---|
| 2025 | $753 | $222,224 | $63,125 | $159,099 |
| 2024 | $811 | $222,224 | $63,125 | $159,099 |
| 2023 | $5,072 | $227,214 | $52,500 | $174,714 |
| 2022 | $4,988 | $202,016 | $52,538 | $149,478 |
| 2021 | $4,758 | $183,414 | $50,000 | $133,414 |
| 2020 | $5,099 | $209,395 | $50,000 | $159,395 |
| 2019 | $4,741 | $218,927 | $50,000 | $168,927 |
| 2017 | $3,978 | $170,193 | $25,000 | $145,193 |
| 2016 | $3,616 | $164,806 | $25,000 | $139,806 |
Source: Public Records
Map
Nearby Homes
- 116 Cooper Dr
- 1228 W Hurst Blvd
- 1213 Walker Dr
- 1208 Harris Ave
- 7620 Brooks Ave
- 1204 Crestview Dr
- 549 Greenwood Cir
- 7515 Evelyn Dr
- 609 Melbourne Rd
- 8228 Fall Crest Dr
- 420 Twin Creek Dr
- 612 Melbourne Ct
- 632 Melbourne Ct
- 3617 Granada Dr
- 7436 Bridges Ave
- 3608 Labadie Dr
- 3616 Labadie Dr
- 3800 Oxley Dr
- 3705 Granada Dr
- 3720 Granada Dr
Your Personal Tour Guide
Ask me questions while you tour the home.