Studio
--
Bath
479,160
Sq Ft
--
Built
About This Home
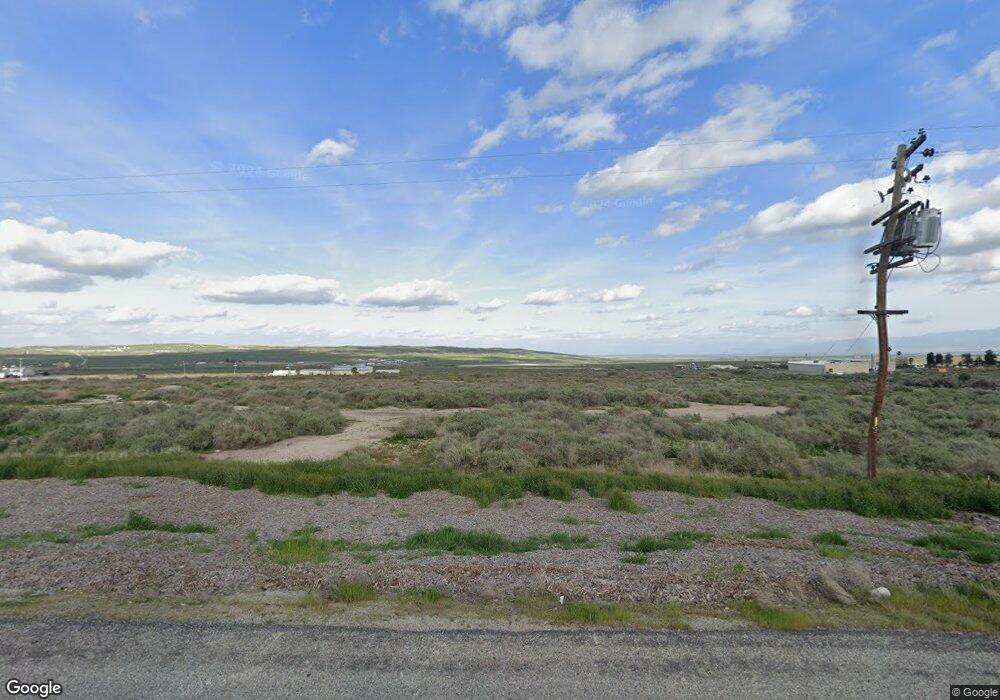
This home is located at 301 E Kern St, Taft, CA 93268. 301 E Kern St is a home located in Kern County with nearby schools including Roosevelt Elementary School, Conley Elementary School, and Lincoln Junior High School.
Ownership History
Date
Name
Owned For
Owner Type
Purchase Details
Closed on
Jul 20, 2006
Sold by
Shahla Faten
Bought by
Shahla Rami
Home Financials for this Owner
Home Financials are based on the most recent Mortgage that was taken out on this home.
Original Mortgage
$400,000
Outstanding Balance
$237,994
Interest Rate
6.69%
Purchase Details
Closed on
Jun 29, 2006
Sold by
Dayco Funding Corp
Bought by
Rami Chahlah Chahla and Rami Shahla
Home Financials for this Owner
Home Financials are based on the most recent Mortgage that was taken out on this home.
Original Mortgage
$400,000
Outstanding Balance
$237,994
Interest Rate
6.69%
Purchase Details
Closed on
Jun 13, 2006
Sold by
Chahlah Raha
Bought by
Chahlah Chahla
Home Financials for this Owner
Home Financials are based on the most recent Mortgage that was taken out on this home.
Original Mortgage
$400,000
Outstanding Balance
$237,994
Interest Rate
6.69%
Purchase Details
Closed on
Jul 28, 2003
Sold by
Corrosion Controls Inc
Bought by
Dayco Funding Corp
Create a Home Valuation Report for This Property
The Home Valuation Report is an in-depth analysis detailing your home's value as well as a comparison with similar homes in the area
Home Values in the Area
Average Home Value in this Area
Purchase History
| Date | Buyer | Sale Price | Title Company |
|---|---|---|---|
| Shahla Rami | -- | First American Title Company | |
| Rami Chahlah Chahla | $555,000 | First American Title Company | |
| Chahlah Chahla | -- | First American Title Company | |
| Dayco Funding Corp | $360,442 | First American Title |
Source: Public Records
Mortgage History
| Date | Status | Borrower | Loan Amount |
|---|---|---|---|
| Open | Rami Chahlah Chahla | $400,000 |
Source: Public Records
Tax History
| Year | Tax Paid | Tax Assessment Tax Assessment Total Assessment is a certain percentage of the fair market value that is determined by local assessors to be the total taxable value of land and additions on the property. | Land | Improvement |
|---|---|---|---|---|
| 2025 | $2,536 | $166,000 | $166,000 | -- |
| 2024 | $3,309 | $166,000 | $166,000 | -- |
| 2023 | $3,309 | $244,666 | $244,666 | $0 |
| 2022 | $2,565 | $184,000 | $184,000 | $0 |
| 2021 | $2,609 | $184,000 | $184,000 | $0 |
| 2020 | $2,416 | $184,000 | $184,000 | $0 |
| 2019 | $2,420 | $184,000 | $184,000 | $0 |
| 2018 | $1,703 | $123,000 | $108,000 | $15,000 |
| 2017 | $1,673 | $123,000 | $108,000 | $15,000 |
| 2016 | $1,776 | $123,000 | $108,000 | $15,000 |
| 2015 | $1,642 | $123,000 | $108,000 | $15,000 |
| 2014 | $1,580 | $123,000 | $108,000 | $15,000 |
Source: Public Records
Map
Nearby Homes
Your Personal Tour Guide
Ask me questions while you tour the home.