301 E Railroad St Waverly, TN 37185
--
Bed
1
Bath
4,008
Sq Ft
2.3
Acres
About This Home
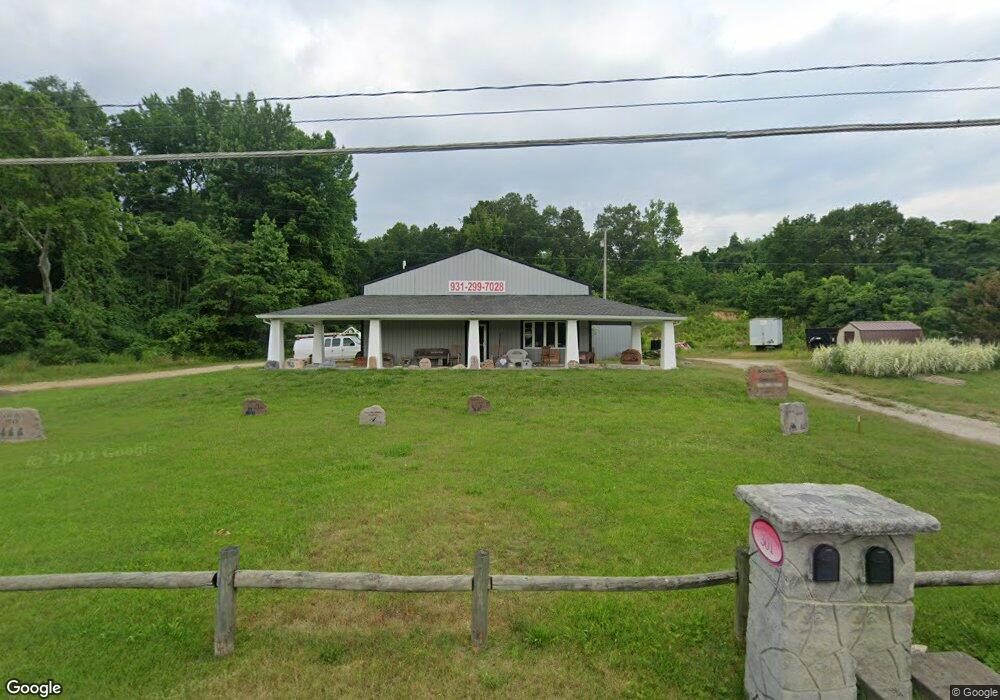
This home is located at 301 E Railroad St, Waverly, TN 37185. 301 E Railroad St is a home located in Humphreys County.
Ownership History
Date
Name
Owned For
Owner Type
Purchase Details
Closed on
Dec 18, 2020
Sold by
Darren W Gilmore Revocable Trust and Gilmore Darren W
Bought by
Gilmore Darren W
Purchase Details
Closed on
Jun 22, 2020
Sold by
Gilmore Darren W and Gilmore Lynn M
Bought by
Gilmore Darren W
Purchase Details
Closed on
Aug 23, 2013
Sold by
Bailey Clint E
Bought by
Gilmore Darren W Lynn M Trus and Gilmore Darren W Revocable Tru
Purchase Details
Closed on
Aug 1, 2005
Sold by
Cruse Freddie C
Bought by
Bailey Clint E
Home Financials for this Owner
Home Financials are based on the most recent Mortgage that was taken out on this home.
Original Mortgage
$20,881
Interest Rate
5.48%
Mortgage Type
Commercial
Purchase Details
Closed on
Nov 26, 2002
Sold by
Wilson Buford H
Bought by
Cruse Freddie C
Purchase Details
Closed on
Feb 4, 1998
Bought by
Wilson Buford H and Wilson Rebecca A
Purchase Details
Closed on
Oct 28, 1993
Bought by
Wilson Buford H
Purchase Details
Closed on
Sep 21, 1989
Bought by
Wilson Buford H and Wilson Rebecca A
Purchase Details
Closed on
Sep 14, 1968
Bought by
Runions Connie J
Purchase Details
Closed on
Oct 30, 1962
Create a Home Valuation Report for This Property
The Home Valuation Report is an in-depth analysis detailing your home's value as well as a comparison with similar homes in the area
Home Values in the Area
Average Home Value in this Area
Purchase History
| Date | Buyer | Sale Price | Title Company |
|---|---|---|---|
| Gilmore Darren W | -- | None Listed On Document | |
| Gilmore Darren W | -- | None Available | |
| Gilmore Darren W | -- | None Available | |
| Gilmore Darren W Lynn M Trus | $42,000 | -- | |
| Bailey Clint E | $20,750 | -- | |
| Cruse Freddie C | $62,000 | -- | |
| Wilson Buford H | -- | -- | |
| Wilson Buford H | -- | -- | |
| Wilson Buford H | $22,000 | -- | |
| Runions Connie J | -- | -- | |
| -- | -- | -- |
Source: Public Records
Mortgage History
| Date | Status | Borrower | Loan Amount |
|---|---|---|---|
| Previous Owner | Not Available | $20,881 |
Source: Public Records
Tax History Compared to Growth
Tax History
| Year | Tax Paid | Tax Assessment Tax Assessment Total Assessment is a certain percentage of the fair market value that is determined by local assessors to be the total taxable value of land and additions on the property. | Land | Improvement |
|---|---|---|---|---|
| 2025 | $1,945 | $63,800 | $0 | $0 |
| 2024 | $1,945 | $63,800 | $7,160 | $56,640 |
| 2023 | $1,944 | $63,800 | $7,160 | $56,640 |
| 2022 | $1,626 | $50,640 | $6,040 | $44,600 |
| 2021 | $1,626 | $50,640 | $6,040 | $44,600 |
| 2020 | $1,626 | $50,640 | $6,040 | $44,600 |
| 2019 | $1,692 | $56,400 | $6,000 | $50,400 |
| 2018 | $1,692 | $51,400 | $6,000 | $45,400 |
| 2017 | $1,692 | $51,400 | $6,000 | $45,400 |
| 2016 | $1,731 | $48,640 | $5,960 | $42,680 |
| 2015 | $1,731 | $48,640 | $5,960 | $42,680 |
| 2014 | $1,731 | $48,640 | $0 | $0 |
Source: Public Records
Map
Nearby Homes
- 307 E Commerce St
- 128 Washington Cir
- 120 Joe St
- 101 Slayden Ave
- 213 E Wyly St
- 413 E Main St
- 116 Fairground Dr
- 209 Pine Hill Dr
- Lot #18 Foxwood Dr
- 126 Fairground Dr
- 0 Bear Hollow Dr Unit RTC3002566
- 0 Bear Hollow Dr Unit 24022394
- 0 Bear Hollow Dr Unit 24022393
- 0 Bear Hollow Dr Unit RTC2817194
- 0 Bear Hollow Dr Unit RTC2747935
- 130 Fairground Dr
- 312 N Maple Ave
- 0 Mill St
- W Blue Creek Rd
- 0 Hwy 13 N Unit RTC2991975
- 211 E Railroad St
- 214 Washington Cir
- 0 Washington Cir
- 101 Washington Cir
- 216 Washington Cir
- 203 Luff St
- 103 Washington Cir
- 201 Luff St
- 303 E Commerce St
- 105 Washington Cir
- 218 Washington Cir
- 107 Washington Cir
- 309 E Commerce St
- 315 E Railroad St
- 107 Luff St
- 220 Washington Cir
- 108 Lucas Ave
- 109 Washington Cir
- 313 E Commerce St
- 209 N Cooley Ave