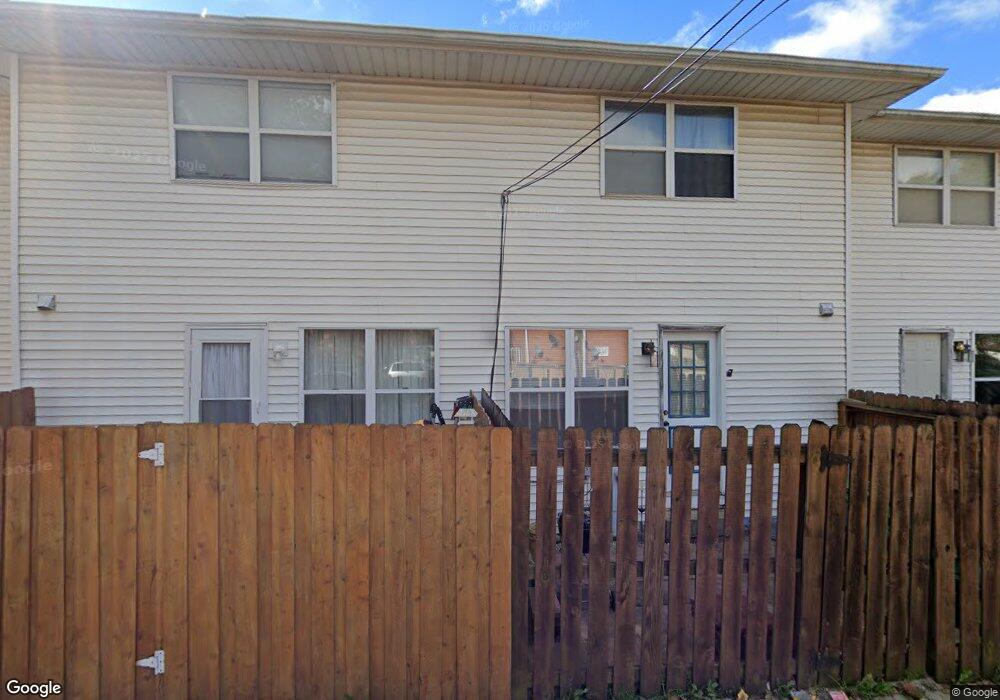
301 Marion Ct Unit D Bensenville, IL 60106
Estimated Value: $125,000 - $272,000
2
Beds
2
Baths
1,100
Sq Ft
$196/Sq Ft
Est. Value
About This Home
This home is located at 301 Marion Ct Unit D, Bensenville, IL 60106 and is currently estimated at $215,273, approximately $195 per square foot. 301 Marion Ct Unit D is a home located in DuPage County with nearby schools including Tioga Elementary School, Blackhawk Middle School, and Fenton High School.
Ownership History
Date
Name
Owned For
Owner Type
Purchase Details
Closed on
Dec 17, 2012
Sold by
Mesa Maria and Mesa Evelio
Bought by
Sanchez Raul
Current Estimated Value
Purchase Details
Closed on
Nov 8, 2007
Sold by
Meza Maria and Mesa Evelio
Bought by
Meza Maria and Mesa Evelio
Home Financials for this Owner
Home Financials are based on the most recent Mortgage that was taken out on this home.
Original Mortgage
$190,800
Interest Rate
6.47%
Mortgage Type
Stand Alone Refi Refinance Of Original Loan
Purchase Details
Closed on
Dec 18, 2003
Sold by
Parda Grazyna
Bought by
Mesa Evelio and Mesa Maria
Home Financials for this Owner
Home Financials are based on the most recent Mortgage that was taken out on this home.
Original Mortgage
$129,920
Interest Rate
7.9%
Mortgage Type
Purchase Money Mortgage
Purchase Details
Closed on
Jun 28, 2002
Sold by
Singh Rehal Rupinder Kaur and Singh Rehalf Harvinder
Bought by
Parda Grayzna
Home Financials for this Owner
Home Financials are based on the most recent Mortgage that was taken out on this home.
Original Mortgage
$144,400
Interest Rate
7.87%
Create a Home Valuation Report for This Property
The Home Valuation Report is an in-depth analysis detailing your home's value as well as a comparison with similar homes in the area
Home Values in the Area
Average Home Value in this Area
Purchase History
| Date | Buyer | Sale Price | Title Company |
|---|---|---|---|
| Sanchez Raul | $55,000 | Fidelity National Title Grou | |
| Meza Maria | -- | Ipj Title Associates | |
| Mesa Evelio | $162,500 | Marquis Title | |
| Parda Grayzna | $152,000 | Djh Title & Abstract |
Source: Public Records
Mortgage History
| Date | Status | Borrower | Loan Amount |
|---|---|---|---|
| Previous Owner | Meza Maria | $190,800 | |
| Previous Owner | Mesa Evelio | $129,920 | |
| Previous Owner | Parda Grayzna | $144,400 | |
| Closed | Mesa Evelio | $32,480 |
Source: Public Records
Tax History Compared to Growth
Tax History
| Year | Tax Paid | Tax Assessment Tax Assessment Total Assessment is a certain percentage of the fair market value that is determined by local assessors to be the total taxable value of land and additions on the property. | Land | Improvement |
|---|---|---|---|---|
| 2024 | $3,912 | $52,987 | $5,265 | $47,722 |
| 2023 | $3,669 | $48,710 | $4,840 | $43,870 |
| 2022 | $3,590 | $45,470 | $4,520 | $40,950 |
| 2021 | $3,391 | $43,550 | $4,330 | $39,220 |
| 2020 | $3,276 | $41,720 | $4,150 | $37,570 |
| 2019 | $3,075 | $40,110 | $3,990 | $36,120 |
| 2018 | $3,129 | $40,110 | $3,990 | $36,120 |
| 2017 | $3,013 | $38,330 | $3,810 | $34,520 |
| 2016 | $2,869 | $35,390 | $3,520 | $31,870 |
| 2015 | $2,757 | $32,690 | $3,250 | $29,440 |
| 2014 | $3,380 | $38,460 | $3,820 | $34,640 |
| 2013 | $3,356 | $39,250 | $3,900 | $35,350 |
Source: Public Records
Map
Nearby Homes
- 215 E Pine Ave
- 329 E Jefferson St
- 499 Park St Unit 2D
- 213 May St
- 232 May St
- 284 E Jefferson St
- 424 May St
- 231 E Red Oak Ave
- 245 S Addison St
- 227-239 W Irving Park Rd
- 11 W Green St Unit 705
- 669 Redmond Ct
- 425 S Walnut St
- 322 S Walnut St
- 112 N Center St Unit A
- 325 W Green St
- 353 Judson St
- 405 Judson St
- 314 Judson St
- 809 Brentwood Dr
- 301 Marion Ct Unit C
- 301 Marion Ct Unit A
- 301 Marion Ct Unit B
- 418 E Pine Ave
- 506 E Pine Ave
- 422 E Pine Ave
- 410 E Pine Ave
- 406 E Pine Ave
- 402 E Pine Ave
- 332 E Pine Ave
- 324 Park St
- 326 Roxanne St
- 325 Roxanne St
- 528 E Pine Ave
- 328 E Pine Ave
- 330 Roxanne St
- 303 Park St
- 326 Park St
- 329 Roxanne St
- 334 Roxanne St