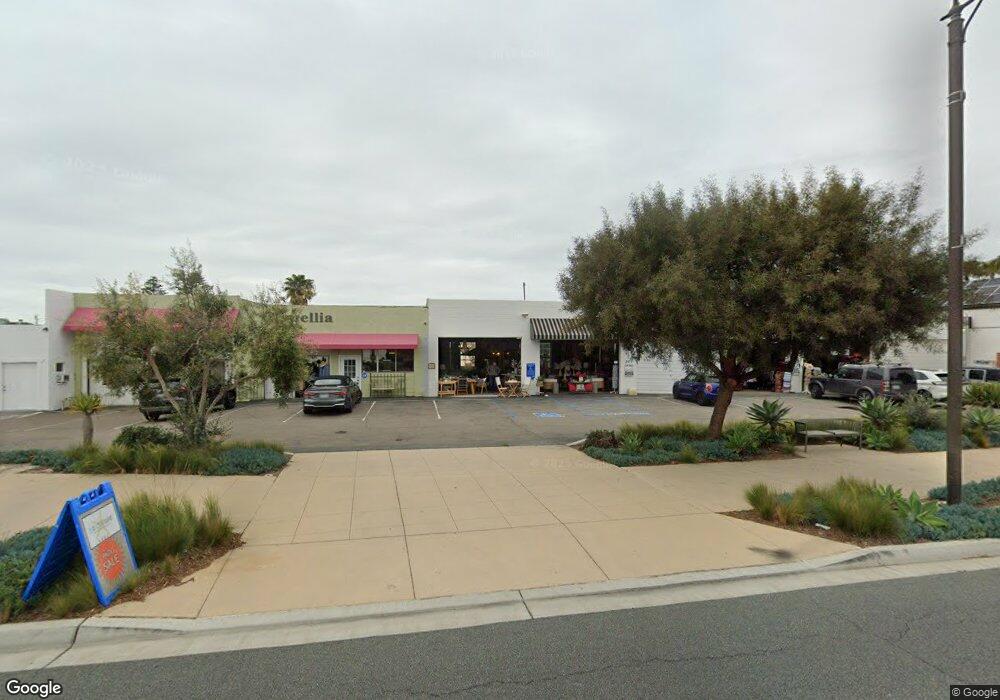
301 N Highway 101 Solana Beach, CA 92075
--
Bed
--
Bath
1,500
Sq Ft
0.62
Acres
About This Home
This home is located at 301 N Highway 101, Solana Beach, CA 92075. 301 N Highway 101 is a home located in San Diego County with nearby schools including Skyline Elementary School, Solana Vista Elementary School, and Earl Warren Middle School.
Ownership History
Date
Name
Owned For
Owner Type
Purchase Details
Closed on
Jun 3, 2016
Sold by
Thomas Jon R
Bought by
Vdm 383 Llc
Home Financials for this Owner
Home Financials are based on the most recent Mortgage that was taken out on this home.
Original Mortgage
$910,000
Outstanding Balance
$726,376
Interest Rate
3.66%
Mortgage Type
Commercial
Purchase Details
Closed on
Jun 23, 2014
Sold by
Mcglathery Rhiannon
Bought by
South Tracy Land Partners Llc
Purchase Details
Closed on
Jun 27, 2012
Sold by
Mcglathery Rhiannon
Bought by
Mcglathery Rhiannon
Purchase Details
Closed on
Sep 25, 2003
Sold by
Murfin Roy H and Murfin Susan E
Bought by
Murfin Roy H and Murfin Susan E
Purchase Details
Closed on
Sep 22, 1997
Sold by
Jean Buckley
Bought by
Buckley Jean W
Create a Home Valuation Report for This Property
The Home Valuation Report is an in-depth analysis detailing your home's value as well as a comparison with similar homes in the area
Home Values in the Area
Average Home Value in this Area
Purchase History
| Date | Buyer | Sale Price | Title Company |
|---|---|---|---|
| Vdm 383 Llc | $1,600,000 | Fidelity National Title | |
| South Tracy Land Partners Llc | $120,000 | Chicago Title Company | |
| Mcglathery Rhiannon | -- | Chicago Title Company | |
| South Tracy Land Partners Llc | $120,000 | Chicago Title Company | |
| Mcglathery Rhiannon | -- | None Available | |
| Mcglathery Rhiannon | -- | None Available | |
| Murfin Roy H | -- | -- | |
| Murfin Roy H | -- | -- | |
| Buckley Jean W | -- | -- |
Source: Public Records
Mortgage History
| Date | Status | Borrower | Loan Amount |
|---|---|---|---|
| Open | Vdm 383 Llc | $910,000 |
Source: Public Records
Tax History Compared to Growth
Tax History
| Year | Tax Paid | Tax Assessment Tax Assessment Total Assessment is a certain percentage of the fair market value that is determined by local assessors to be the total taxable value of land and additions on the property. | Land | Improvement |
|---|---|---|---|---|
| 2025 | $7,786 | $726,517 | $671,852 | $54,665 |
| 2024 | $7,786 | $712,273 | $658,679 | $53,594 |
| 2023 | $7,621 | $698,308 | $645,764 | $52,544 |
| 2022 | $7,503 | $684,616 | $633,102 | $51,514 |
| 2021 | $7,375 | $671,193 | $620,689 | $50,504 |
| 2020 | $7,312 | $664,312 | $614,325 | $49,987 |
| 2019 | $7,174 | $651,287 | $602,280 | $49,007 |
| 2018 | $7,041 | $638,518 | $590,471 | $48,047 |
| 2017 | $6,925 | $625,999 | $578,894 | $47,105 |
| 2016 | $3,577 | $325,499 | $308,243 | $17,256 |
| 2015 | $3,526 | $320,610 | $303,613 | $16,997 |
| 2014 | $1,578 | $146,522 | $146,522 | $0 |
Source: Public Records
Map
Nearby Homes
- 148 N Acacia Ave
- 505 N Cedros Ave
- 422 Seabright Ln
- 241 E Cliff St
- 515 N Acacia Ave
- 649 Seabright Ln
- 147 S Rios Ave
- 241 S Sierra Ave
- 308 Corto St
- 810 Seabright Ln
- 325 S Sierra Ave Unit 20
- 779 Barbara Ave
- 429 S Sierra Ave Unit 324
- 441 S Sierra Ave Unit 208
- 429 S Sierra Ave Unit 151
- 435 S Sierra Ave Unit 118
- 515 S Sierra Ave Unit 124
- 521 S Rios Ave
- 455 Glencrest Dr
- 585 S Sierra Ave Unit 27
- 312 N Acacia Ave
- 309 N Acacia Ave
- 315 N Acacia Ave
- 339 N Highway 101
- 321 N Acacia Ave
- 0 N Acacia Ave
- 327 N Acacia Ave
- 333 N Acacia Ave
- 308 N Sierra Ave
- 312 N Sierra Ave
- 304 N Sierra Ave
- 205 Estrella St
- 318 N Sierra Ave
- 345 N Highway 101
- 344 N Acacia Ave
- 339 N Acacia Ave
- 344-46 N Acacia Ave
- 322 N Sierra Ave
- 326 N Sierra Ave
- 239 N Acacia Ave