Estimated Value: $39,000 - $153,000
2
Beds
1
Bath
732
Sq Ft
$107/Sq Ft
Est. Value
About This Home
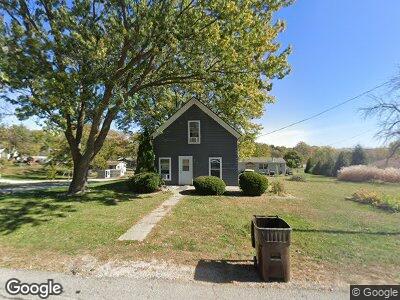
This home is located at 301 S Browning St, Afton, IA 50830 and is currently estimated at $78,229, approximately $106 per square foot. 301 S Browning St is a home with nearby schools including East Union Middle/High School.
Ownership History
Date
Name
Owned For
Owner Type
Purchase Details
Closed on
Sep 9, 2022
Sold by
Martin Dustin Daniel
Bought by
Craig Josh
Current Estimated Value
Home Financials for this Owner
Home Financials are based on the most recent Mortgage that was taken out on this home.
Original Mortgage
$43,700
Outstanding Balance
$42,390
Interest Rate
5.3%
Mortgage Type
New Conventional
Estimated Equity
$26,196
Purchase Details
Closed on
Jun 11, 2021
Sold by
Louise Ferber Julie
Bought by
Martin Dustin Daniel
Create a Home Valuation Report for This Property
The Home Valuation Report is an in-depth analysis detailing your home's value as well as a comparison with similar homes in the area
Home Values in the Area
Average Home Value in this Area
Purchase History
| Date | Buyer | Sale Price | Title Company |
|---|---|---|---|
| Craig Josh | $46,000 | -- | |
| Martin Dustin Daniel | -- | None Listed On Document |
Source: Public Records
Mortgage History
| Date | Status | Borrower | Loan Amount |
|---|---|---|---|
| Open | Craig Josh | $43,700 | |
| Previous Owner | Martin Dustin D | $43,714 |
Source: Public Records
Tax History Compared to Growth
Tax History
| Year | Tax Paid | Tax Assessment Tax Assessment Total Assessment is a certain percentage of the fair market value that is determined by local assessors to be the total taxable value of land and additions on the property. | Land | Improvement |
|---|---|---|---|---|
| 2024 | $684 | $41,300 | $9,000 | $32,300 |
| 2023 | $676 | $35,320 | $6,740 | $28,580 |
| 2022 | $1,354 | $30,090 | $4,820 | $25,270 |
| 2021 | $1,354 | $57,090 | $4,500 | $52,590 |
| 2020 | $972 | $49,960 | $2,680 | $47,280 |
| 2019 | $1,000 | $49,960 | $0 | $0 |
| 2018 | $950 | $49,960 | $0 | $0 |
| 2017 | $994 | $49,960 | $0 | $0 |
| 2016 | $964 | $49,960 | $0 | $0 |
| 2015 | $964 | $45,840 | $0 | $0 |
| 2014 | $880 | $45,840 | $0 | $0 |
Source: Public Records
Map
Nearby Homes