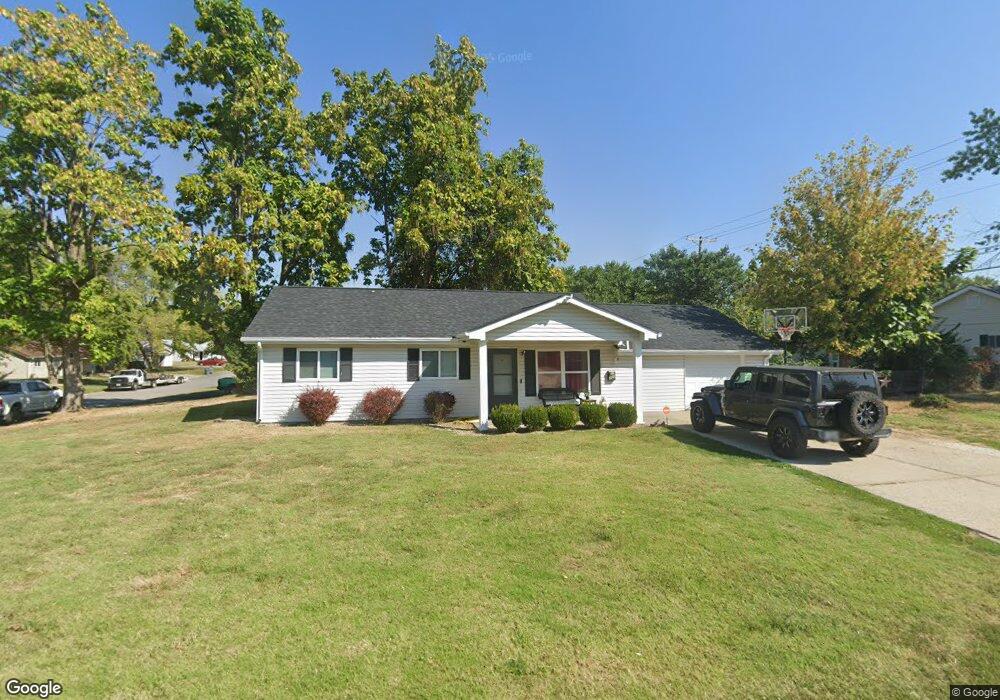
301 Saint Joseph Ave O Fallon, MO 63366
Estimated Value: $236,795 - $251,000
3
Beds
2
Baths
1,100
Sq Ft
$220/Sq Ft
Est. Value
About This Home
This home is located at 301 Saint Joseph Ave, O Fallon, MO 63366 and is currently estimated at $241,949, approximately $219 per square foot. 301 Saint Joseph Ave is a home located in St. Charles County with nearby schools including Forest Park Elementary School, Joseph L. Mudd Elementary School, and Fort Zumwalt North Middle School.
Ownership History
Date
Name
Owned For
Owner Type
Purchase Details
Closed on
Jul 15, 2008
Sold by
Vomund Kenneth M and Vomund Fay A
Bought by
Vomund Kenneth M and Vomund Fay A
Current Estimated Value
Purchase Details
Closed on
Jun 2, 2008
Sold by
T & C Properties Llc
Bought by
Vomund Kenneth M and Vomund Fay A
Purchase Details
Closed on
Apr 10, 2008
Sold by
Cody Properties Llc
Bought by
T & C Properties Llc
Purchase Details
Closed on
Mar 20, 2008
Sold by
Bowler Ted G and Mason David P
Bought by
Cody Properties
Purchase Details
Closed on
Dec 29, 2000
Sold by
Robinson Audrelee and Maune Shirley
Bought by
Bowler Ted G and Mason David P
Home Financials for this Owner
Home Financials are based on the most recent Mortgage that was taken out on this home.
Original Mortgage
$73,527
Interest Rate
7.78%
Mortgage Type
FHA
Create a Home Valuation Report for This Property
The Home Valuation Report is an in-depth analysis detailing your home's value as well as a comparison with similar homes in the area
Home Values in the Area
Average Home Value in this Area
Purchase History
| Date | Buyer | Sale Price | Title Company |
|---|---|---|---|
| Vomund Kenneth M | -- | None Available | |
| Vomund Kenneth M | -- | Etc | |
| T & C Properties Llc | -- | Inv | |
| Cody Properties | $65,900 | Inv | |
| Bowler Ted G | -- | -- |
Source: Public Records
Mortgage History
| Date | Status | Borrower | Loan Amount |
|---|---|---|---|
| Previous Owner | Bowler Ted G | $73,527 |
Source: Public Records
Tax History
| Year | Tax Paid | Tax Assessment Tax Assessment Total Assessment is a certain percentage of the fair market value that is determined by local assessors to be the total taxable value of land and additions on the property. | Land | Improvement |
|---|---|---|---|---|
| 2025 | $2,313 | $36,244 | -- | -- |
| 2023 | $2,314 | $34,704 | $0 | $0 |
| 2022 | $1,892 | $26,309 | $0 | $0 |
| 2021 | $1,894 | $26,309 | $0 | $0 |
| 2020 | $1,792 | $24,183 | $0 | $0 |
| 2019 | $1,796 | $24,183 | $0 | $0 |
| 2018 | $1,666 | $21,394 | $0 | $0 |
| 2017 | $1,635 | $21,394 | $0 | $0 |
| 2016 | $1,521 | $19,824 | $0 | $0 |
| 2015 | $1,414 | $19,824 | $0 | $0 |
| 2014 | $1,258 | $17,341 | $0 | $0 |
Source: Public Records
Map
Nearby Homes
- 409 Saint Joseph Ave
- 201 Allen Dr
- 203 Saint Margaret Ln
- 508 Saint Christopher Dr
- 805 Saint Joseph Ave
- 1102 Danielle Elizabeth Ct
- 31 Piepers Glen Ct
- 205 E Elm St
- 6 S Boxwood Ln
- 1110 Cypress Dr
- 309 E Pitman St
- 503 Imperial Ct
- 0 Tom Ginnever Ave
- 1358 Deerfield Estates Dr
- 634 Homerun Dr Unit 34N
- 632 Homerun Dr Unit 33N
- 17 Homefield Gardens Dr
- 423 Woodlawn Ave
- 730 Homerun Dr Unit 76N
- 57 Green Park Ln
- 604 Saint Paul Ln
- 303 Saint Joseph Ave
- 605 Saint Margaret Ln
- 302 Saint Joseph Ave
- 606 Saint Paul Ln
- 211 Saint Joseph Ave
- 607 Saint Margaret Ln
- 304 Saint Joseph Ave
- 605 Saint Paul Ln
- 212 Saint Joseph Ave
- 26 Saint Paul Ct
- 702 Saint Paul Ln
- 607 Saint Paul Ln
- 609 Saint Margaret Ln
- 505 Saint Margaret Ln
- 209 Saint Joseph Ave
- 15 Saint Paul Ct
- 401 Saint Joseph Ave
- 604 Saint Margaret Ln
- 703 Saint Paul Ln
Your Personal Tour Guide
Ask me questions while you tour the home.