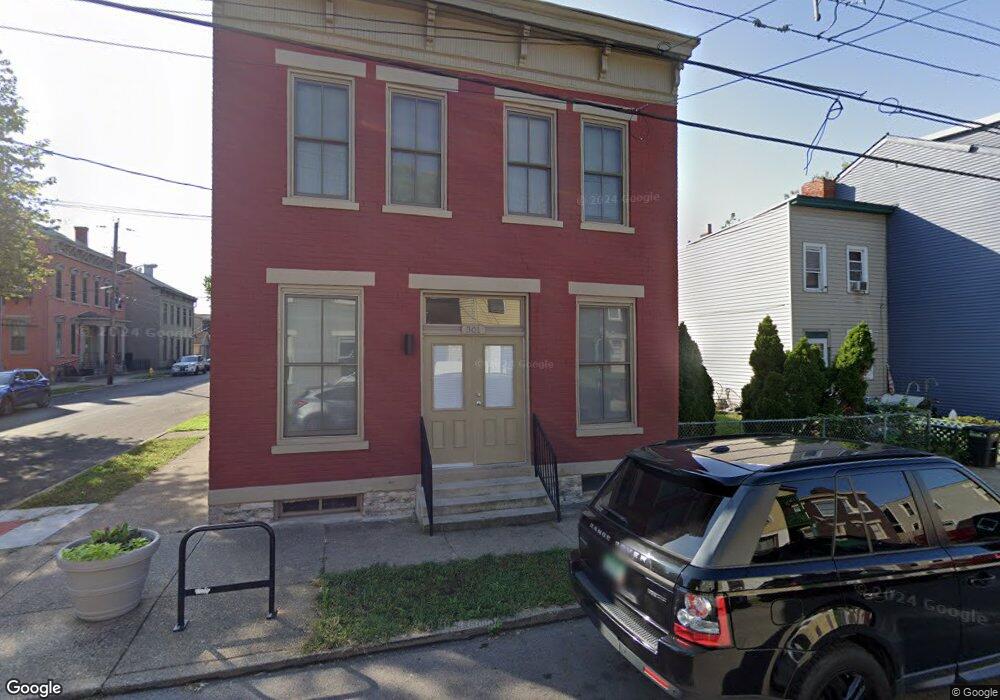
301 W 7th St Covington, KY 41011
Downtown Covington NeighborhoodEstimated Value: $358,000
Studio
2
Baths
3,098
Sq Ft
$116/Sq Ft
Est. Value
About This Home
This home is located at 301 W 7th St, Covington, KY 41011 and is currently estimated at $358,000, approximately $115 per square foot. 301 W 7th St is a home located in Kenton County with nearby schools including Holmes High School, Prince of Peace School, and Saint Augustine Catholic School.
Ownership History
Date
Name
Owned For
Owner Type
Purchase Details
Closed on
Feb 2, 2015
Sold by
Dudley Properties Ii Llc
Bought by
Main Strasse Holding Llc
Current Estimated Value
Home Financials for this Owner
Home Financials are based on the most recent Mortgage that was taken out on this home.
Original Mortgage
$1,494,300
Outstanding Balance
$1,140,447
Interest Rate
3.9%
Mortgage Type
Purchase Money Mortgage
Estimated Equity
-$782,447
Purchase Details
Closed on
Oct 10, 2007
Sold by
Sei Development Co Inc
Bought by
Dudley Properties Ii Llc
Create a Home Valuation Report for This Property
The Home Valuation Report is an in-depth analysis detailing your home's value as well as a comparison with similar homes in the area
Home Values in the Area
Average Home Value in this Area
Purchase History
| Date | Buyer | Sale Price | Title Company |
|---|---|---|---|
| Main Strasse Holding Llc | $2,728,000 | None Available | |
| Dudley Properties Ii Llc | $1,875,000 | None Available | |
| Sei Development Co Inc | $1,875,000 | None Available |
Source: Public Records
Mortgage History
| Date | Status | Borrower | Loan Amount |
|---|---|---|---|
| Open | Main Strasse Holding Llc | $1,494,300 |
Source: Public Records
Tax History
| Year | Tax Paid | Tax Assessment Tax Assessment Total Assessment is a certain percentage of the fair market value that is determined by local assessors to be the total taxable value of land and additions on the property. | Land | Improvement |
|---|---|---|---|---|
| 2025 | $2,385 | $180,000 | $20,000 | $160,000 |
| 2024 | $2,367 | $180,000 | $20,000 | $160,000 |
| 2023 | $2,398 | $180,000 | $20,000 | $160,000 |
| 2022 | $2,630 | $180,000 | $20,000 | $160,000 |
| 2021 | $2,692 | $160,000 | $15,000 | $145,000 |
| 2020 | $2,680 | $160,000 | $15,000 | $145,000 |
| 2019 | $2,707 | $160,000 | $15,000 | $145,000 |
| 2018 | $2,759 | $160,000 | $15,000 | $145,000 |
| 2017 | $2,733 | $156,000 | $5,000 | $151,000 |
| 2015 | $2,225 | $188,100 | $5,000 | $183,100 |
| 2014 | $1,938 | $100,000 | $5,000 | $95,000 |
Source: Public Records
Map
Nearby Homes
- 328 W 6th St
- 501 Johnson St
- 138 W Pike St
- 346 W 9th St
- 130 W 4th St
- 128 W 4th St
- 126 W 4th St
- 124 W 4th St
- 1025 Banklick St
- 515 W 9th St
- 1212-1234 W Pike St
- 656 W Pike St
- 664 W Pike St
- 652 Western Ave
- 328 W Martin Luther King Junior Blvd
- 112 E 5th St
- 114 E 5th St
- 728 Western Ave
- 501 Western Ave
- 100 W Rivercenter Blvd Unit PH3B
Your Personal Tour Guide
Ask me questions while you tour the home.