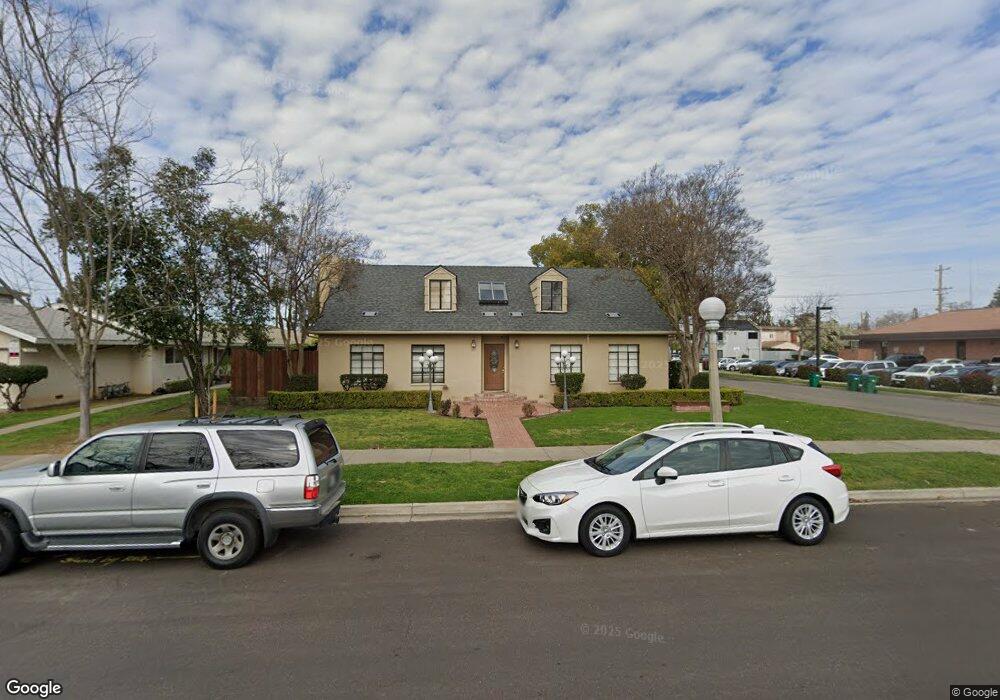
301 W Locust St Lodi, CA 95240
Downtown Lodi NeighborhoodEstimated Value: $406,000 - $726,000
3
Beds
2
Baths
2,157
Sq Ft
$275/Sq Ft
Est. Value
About This Home
This home is located at 301 W Locust St, Lodi, CA 95240 and is currently estimated at $593,643, approximately $275 per square foot. 301 W Locust St is a home located in San Joaquin County with nearby schools including George Washington Elementary School, Millswood Middle School, and Lodi High School.
Ownership History
Date
Name
Owned For
Owner Type
Purchase Details
Closed on
Aug 23, 2005
Sold by
Harrill Chari L and Pokrajac Marlene L
Bought by
Carroll James W
Current Estimated Value
Purchase Details
Closed on
Jun 26, 2002
Sold by
Carroll James W
Bought by
Harrill Chari L and Pokrajac Marlene L
Purchase Details
Closed on
Sep 3, 1997
Sold by
Uhrich Edith A and The Edith A Uhrich 1996 Trust
Bought by
Carroll James W
Home Financials for this Owner
Home Financials are based on the most recent Mortgage that was taken out on this home.
Original Mortgage
$159,000
Interest Rate
7.42%
Mortgage Type
Seller Take Back
Purchase Details
Closed on
Nov 12, 1996
Sold by
Uhrich Edith A
Bought by
Uhrich Edith A and Edith A Uhrich 1996 Trust
Purchase Details
Closed on
Aug 13, 1996
Sold by
Uhrich Daniel W
Bought by
Uhrich Edith Ann Webber
Purchase Details
Closed on
Nov 28, 1994
Sold by
Uhrich Sharron A
Bought by
Uhrich Daniel W
Create a Home Valuation Report for This Property
The Home Valuation Report is an in-depth analysis detailing your home's value as well as a comparison with similar homes in the area
Home Values in the Area
Average Home Value in this Area
Purchase History
| Date | Buyer | Sale Price | Title Company |
|---|---|---|---|
| Carroll James W | -- | -- | |
| Harrill Chari L | -- | Alliance Title Company | |
| Carroll James W | $180,000 | Central Valley Title Company | |
| Uhrich Edith A | -- | -- | |
| Uhrich Edith Ann Webber | $160,000 | Commonwealth Land Title Ins | |
| Uhrich Daniel W | -- | Fidelity National Title Co |
Source: Public Records
Mortgage History
| Date | Status | Borrower | Loan Amount |
|---|---|---|---|
| Previous Owner | Carroll James W | $159,000 |
Source: Public Records
Tax History Compared to Growth
Tax History
| Year | Tax Paid | Tax Assessment Tax Assessment Total Assessment is a certain percentage of the fair market value that is determined by local assessors to be the total taxable value of land and additions on the property. | Land | Improvement |
|---|---|---|---|---|
| 2025 | $4,149 | $381,601 | $95,797 | $285,804 |
| 2024 | $4,036 | $374,119 | $93,919 | $280,200 |
| 2023 | $3,980 | $366,784 | $92,078 | $274,706 |
| 2022 | $3,892 | $359,593 | $90,273 | $269,320 |
| 2021 | $3,963 | $352,543 | $88,503 | $264,040 |
| 2020 | $3,859 | $348,929 | $87,596 | $261,333 |
| 2019 | $3,782 | $342,088 | $85,879 | $256,209 |
| 2018 | $3,729 | $335,382 | $84,196 | $251,186 |
| 2017 | $3,646 | $328,807 | $82,546 | $246,261 |
| 2016 | $3,418 | $322,360 | $80,927 | $241,433 |
| 2014 | $3,160 | $294,800 | $88,000 | $206,800 |
Source: Public Records
Map
Nearby Homes
- 303 W Lockeford St
- 411 W Locust St
- 431 W Elm St
- 101 W Lockeford St
- 419 Matthew Plaza
- 433 N Church St
- 619 W Elm St
- 518 N Church St
- 625 N Church St Unit 8
- 309 Forrest Ave
- Lot 8 Raya Rd
- 317 Church St
- 532 Louie Ave
- 400 N Fairmont Ave
- 121 N Central Ave
- 335 E Oak St
- 329 E Walnut St
- 537 Palm Ave
- 542 Sturla St
- 421 E Elm St
- 302 W Locust St
- 220 W Locust St
- 306 W Locust St
- 300 W Lockeford St
- 310 W Lockeford St
- 312 W Locust St
- 310 W Locust St
- 120 N Pleasant Ave
- 314 W Lockeford St
- 333 W Locust St
- 320 W Locust St
- 316 W Lockeford St
- 116 N Pleasant Ave
- 222 W Lockeford St Unit 6
- 222 W Lockeford St Unit 2
- 214 W Lockeford St
- 401 W Locust St
- 400 W Lockeford St
- 402 W Locust St
- 305 W Lockeford St